From an event question to a research list.
One real StockAtlas session, step by step. A researcher had a date and a hypothesis, not a list of tickers. Here is how the map turned that into 63 names to investigate.
This is an educational example adapted from a research use case, not a verified investment result. Event labels are the researcher's hypotheses. StockAtlas shows what moved together; it does not establish why.
Ask the question.
The question was: which instruments showed a similar pattern on dates tied to escalation in the Iran conflict? The researcher labeled one of those dates, March 18, 2026, as a South Pars example.
A ticker-first tool would have stalled here. Energy names are an obvious guess, but the point of the exercise was to find what actually moved together, including instruments outside the obvious sector.
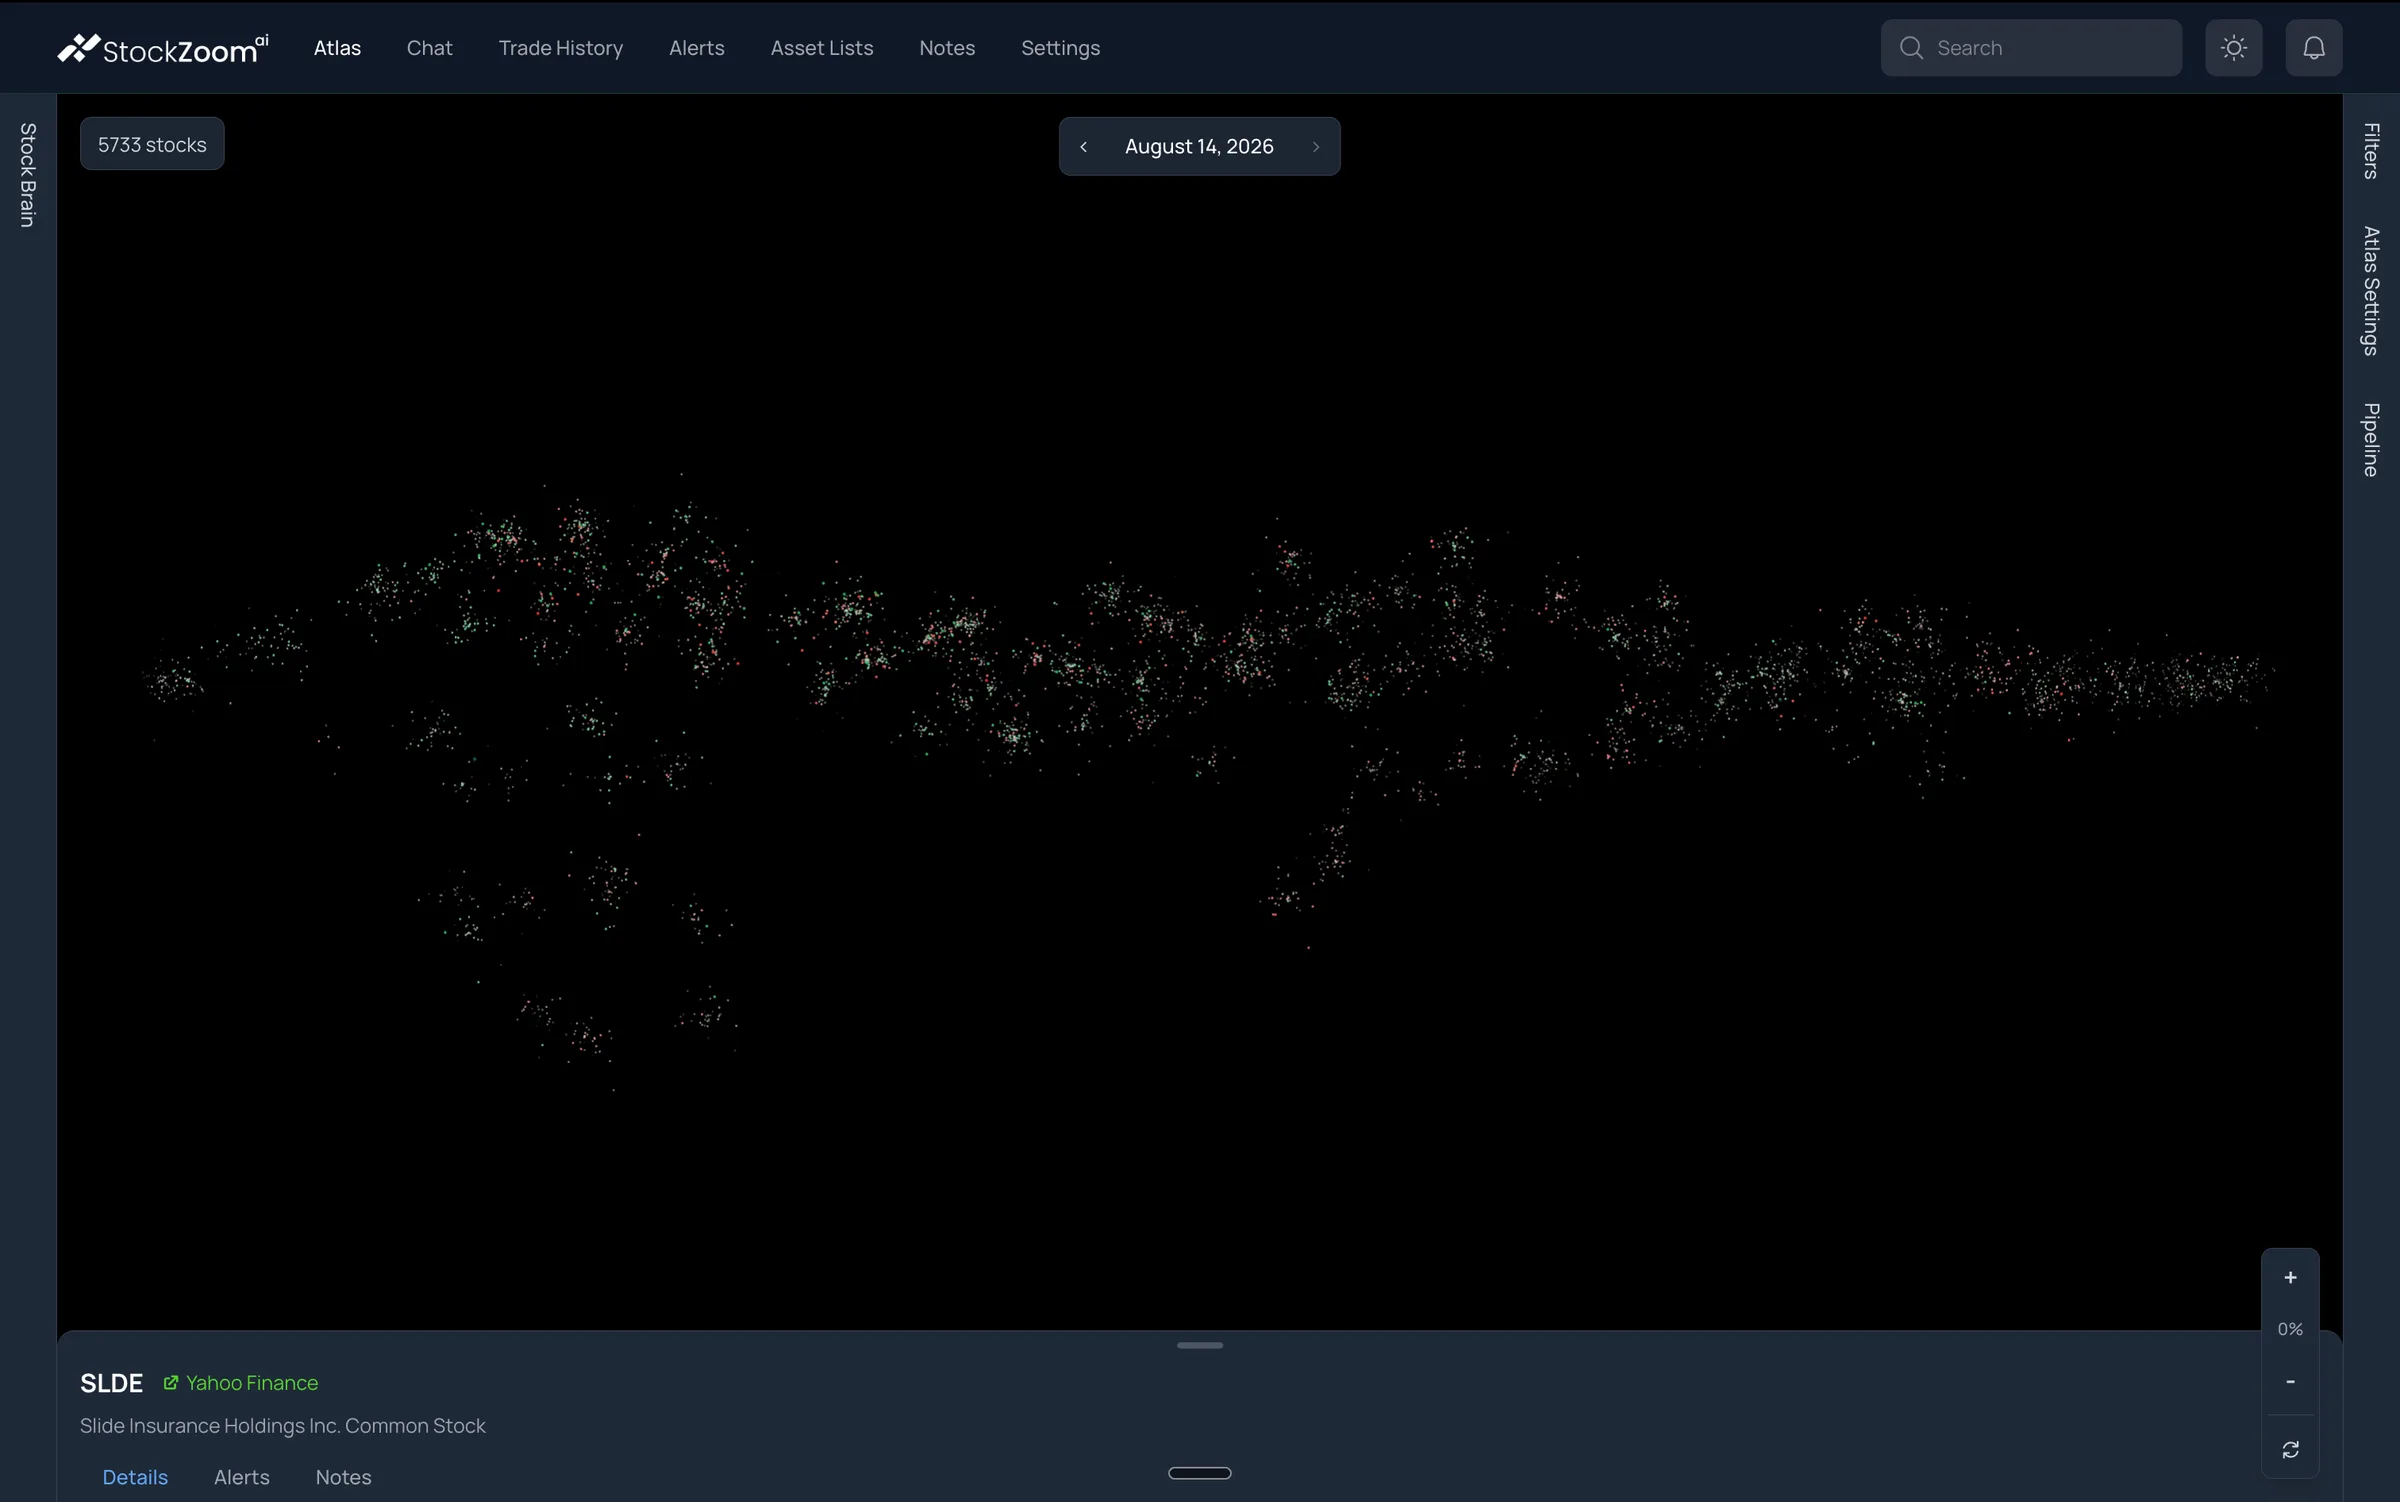
Choose the date and hold everything else still.
Open the calendar and pick the date. Then record the metric assigned to each visual channel, the thresholds, which lists are checked, and the density setting. Those stay fixed for every date you compare, so what changes on screen is the market and not your configuration.
A daily measurement includes everything that happened that day, not just the minutes around a headline. Note the event's source and timing separately.
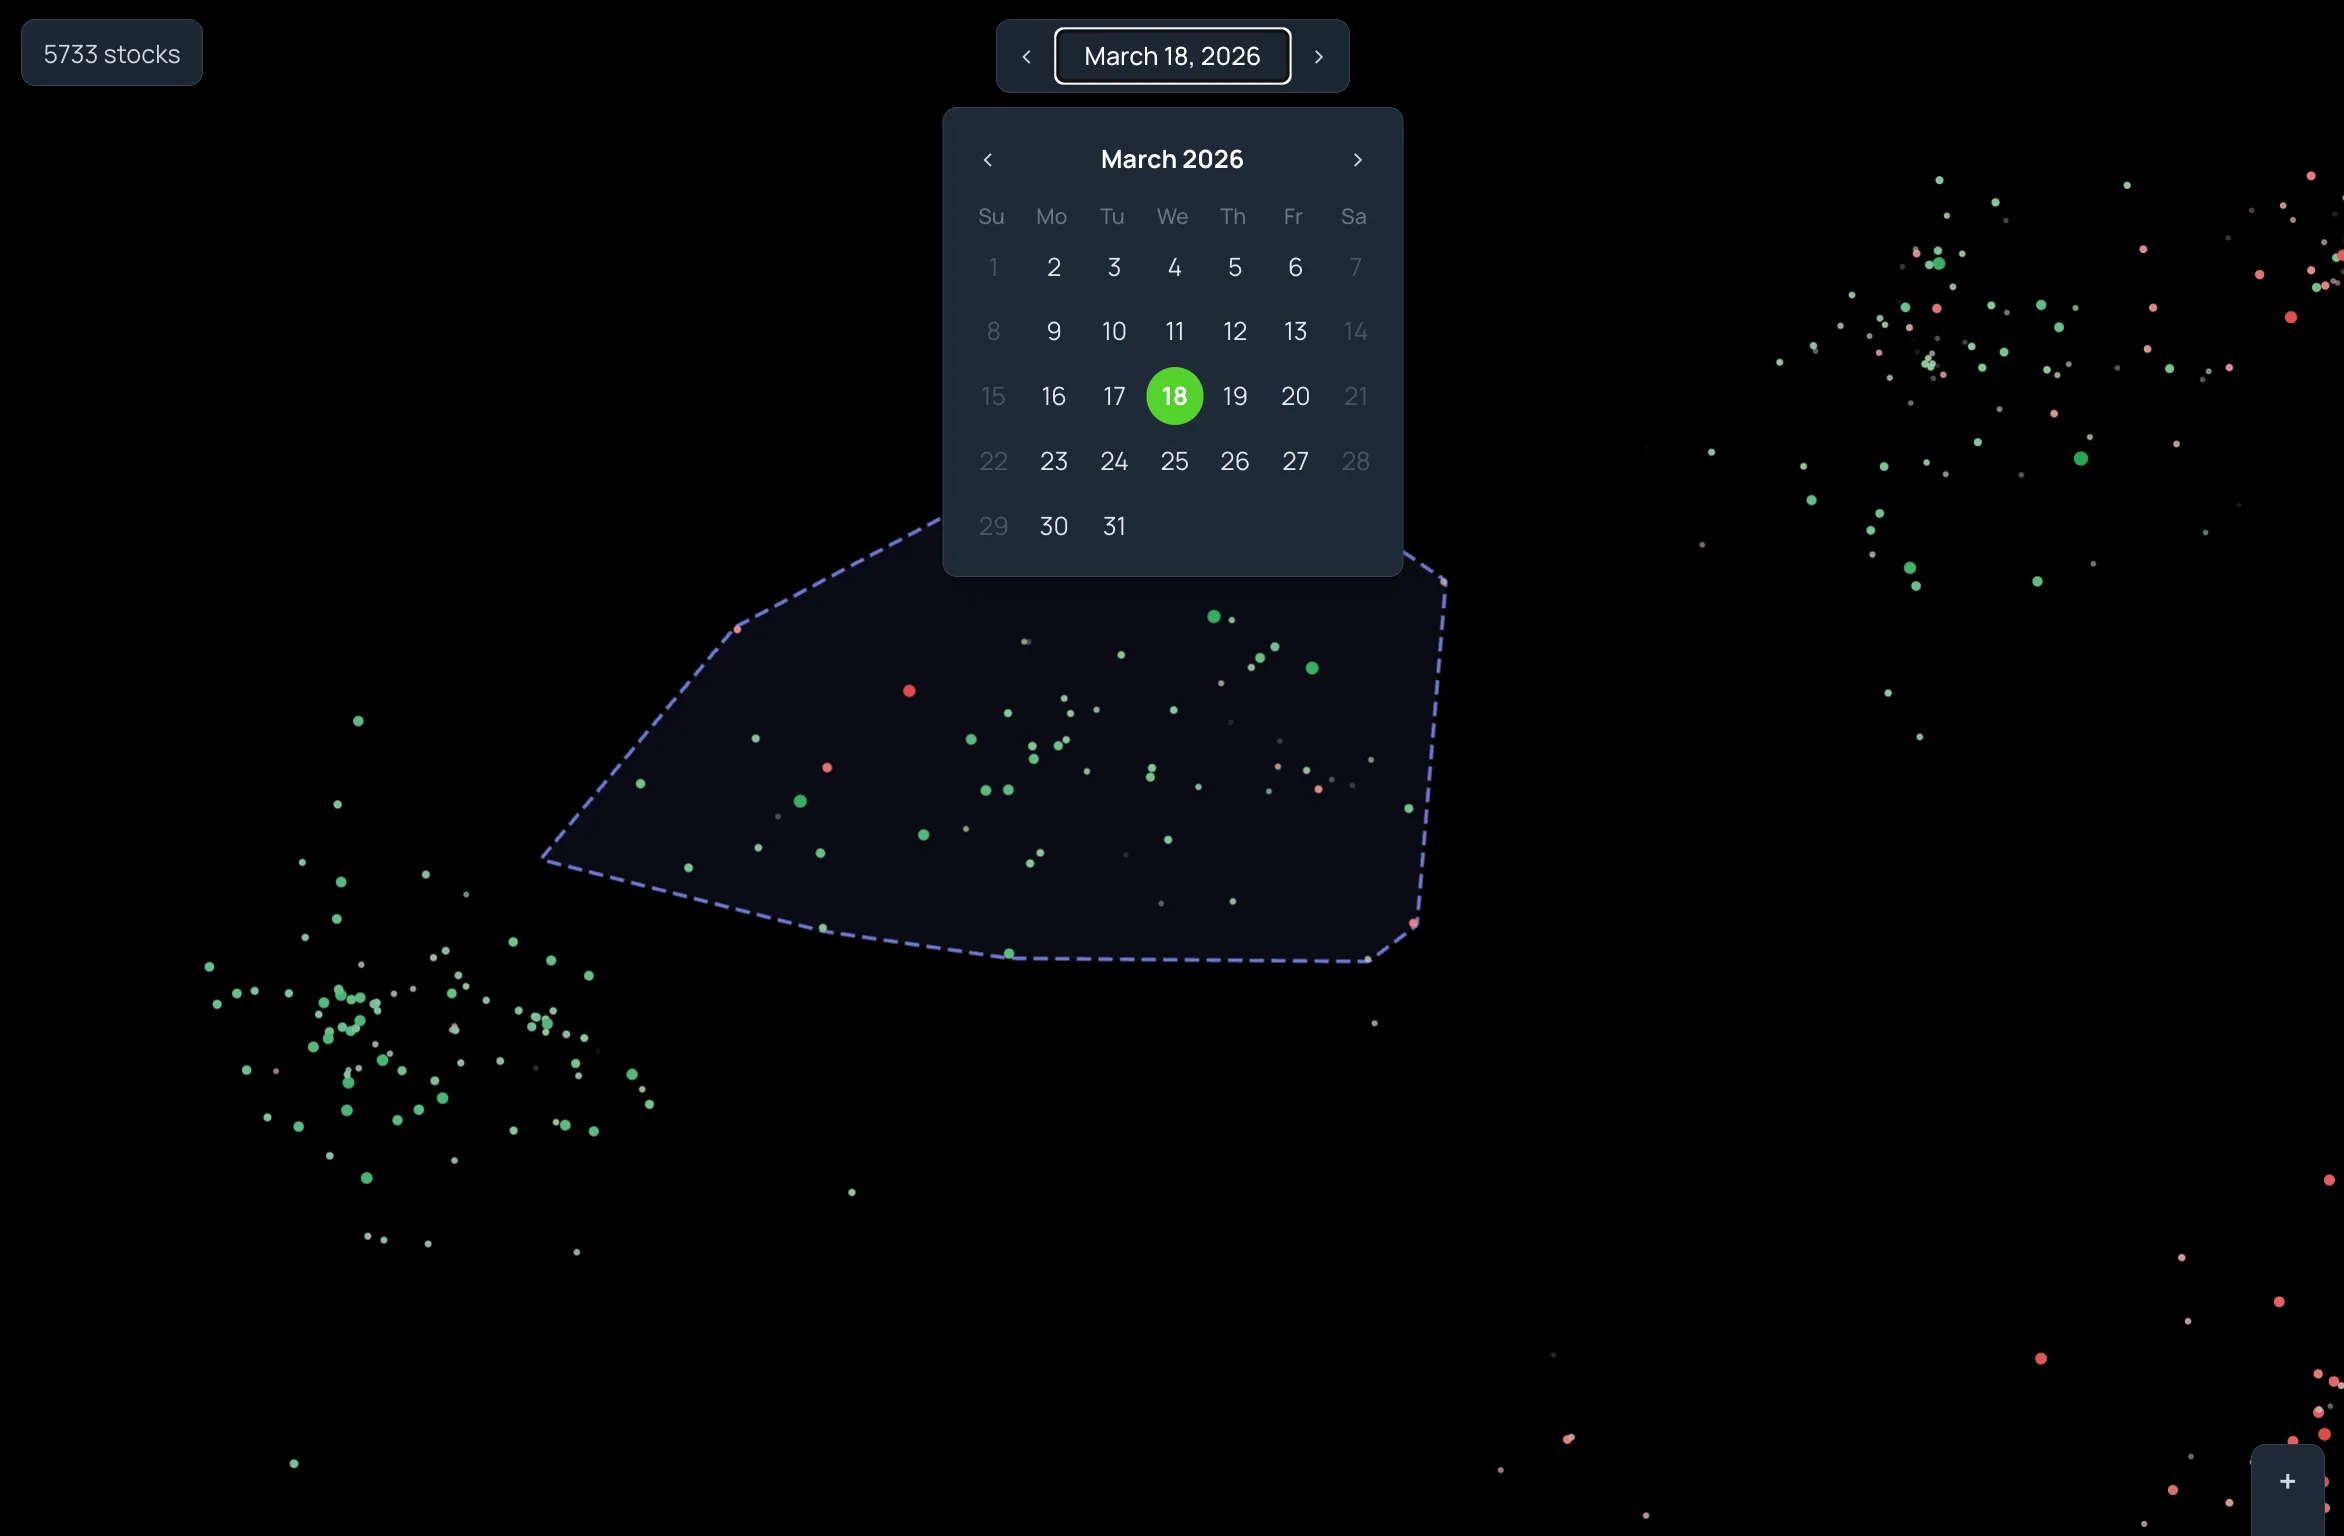
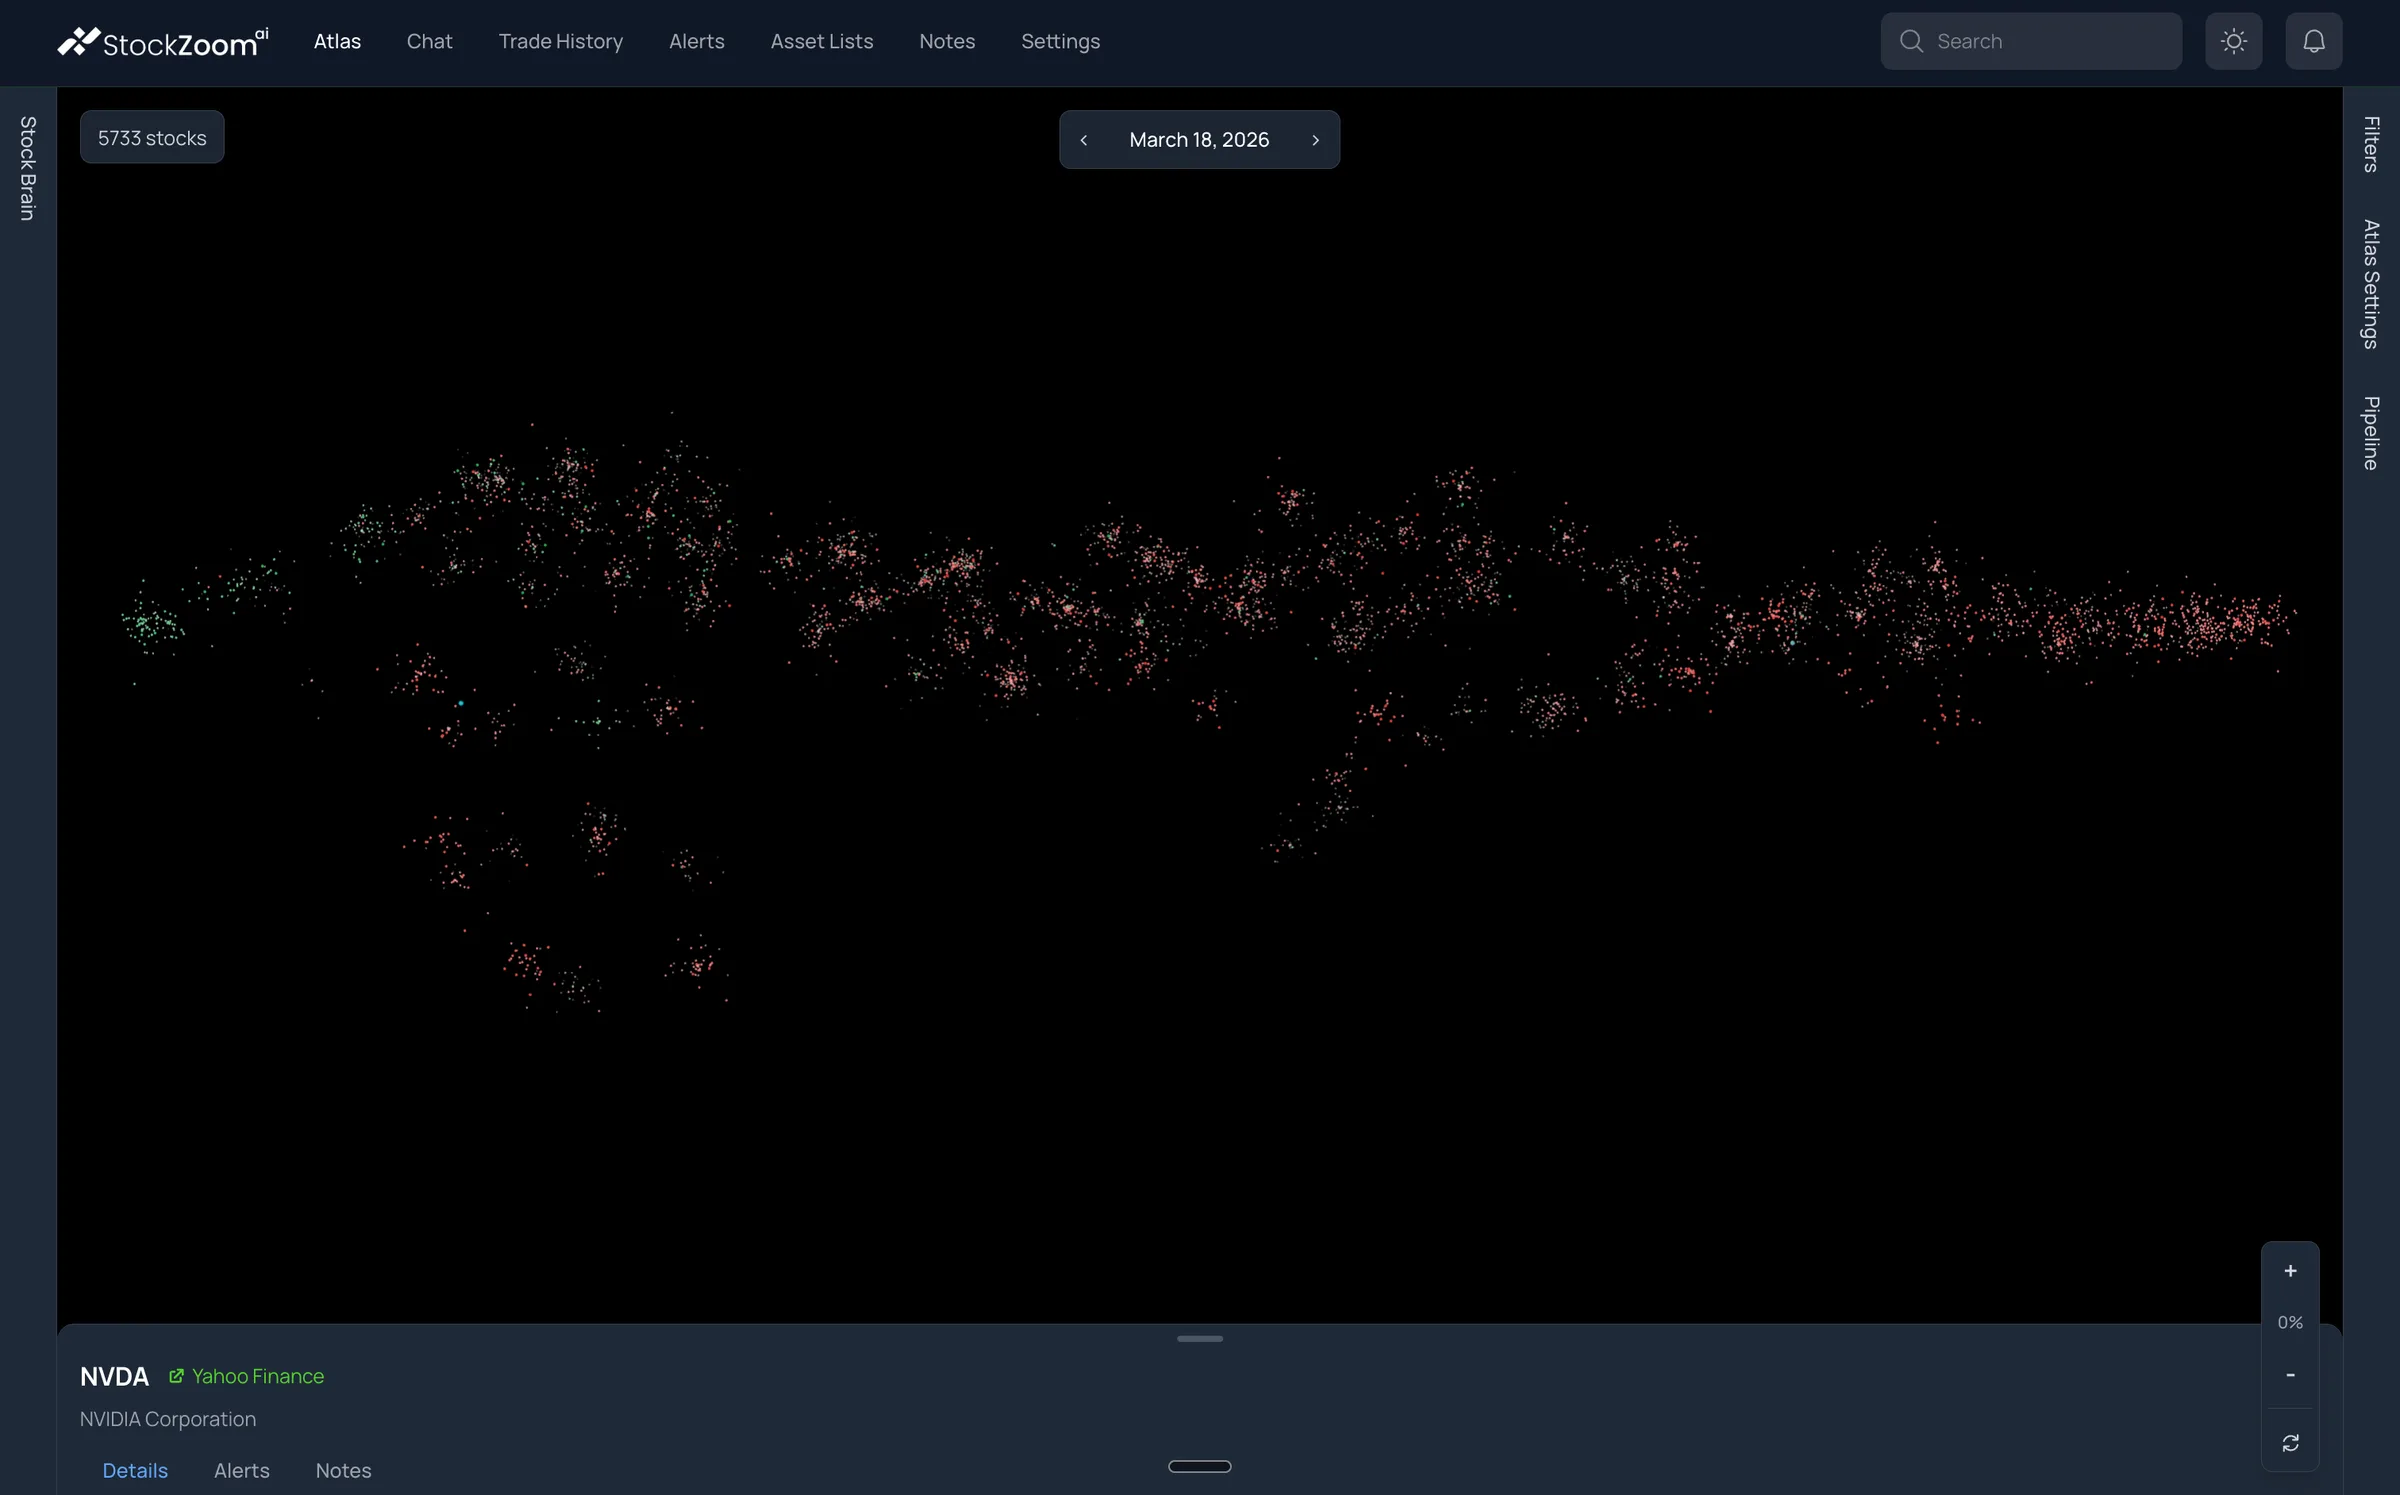
Find the region with a shared pattern.
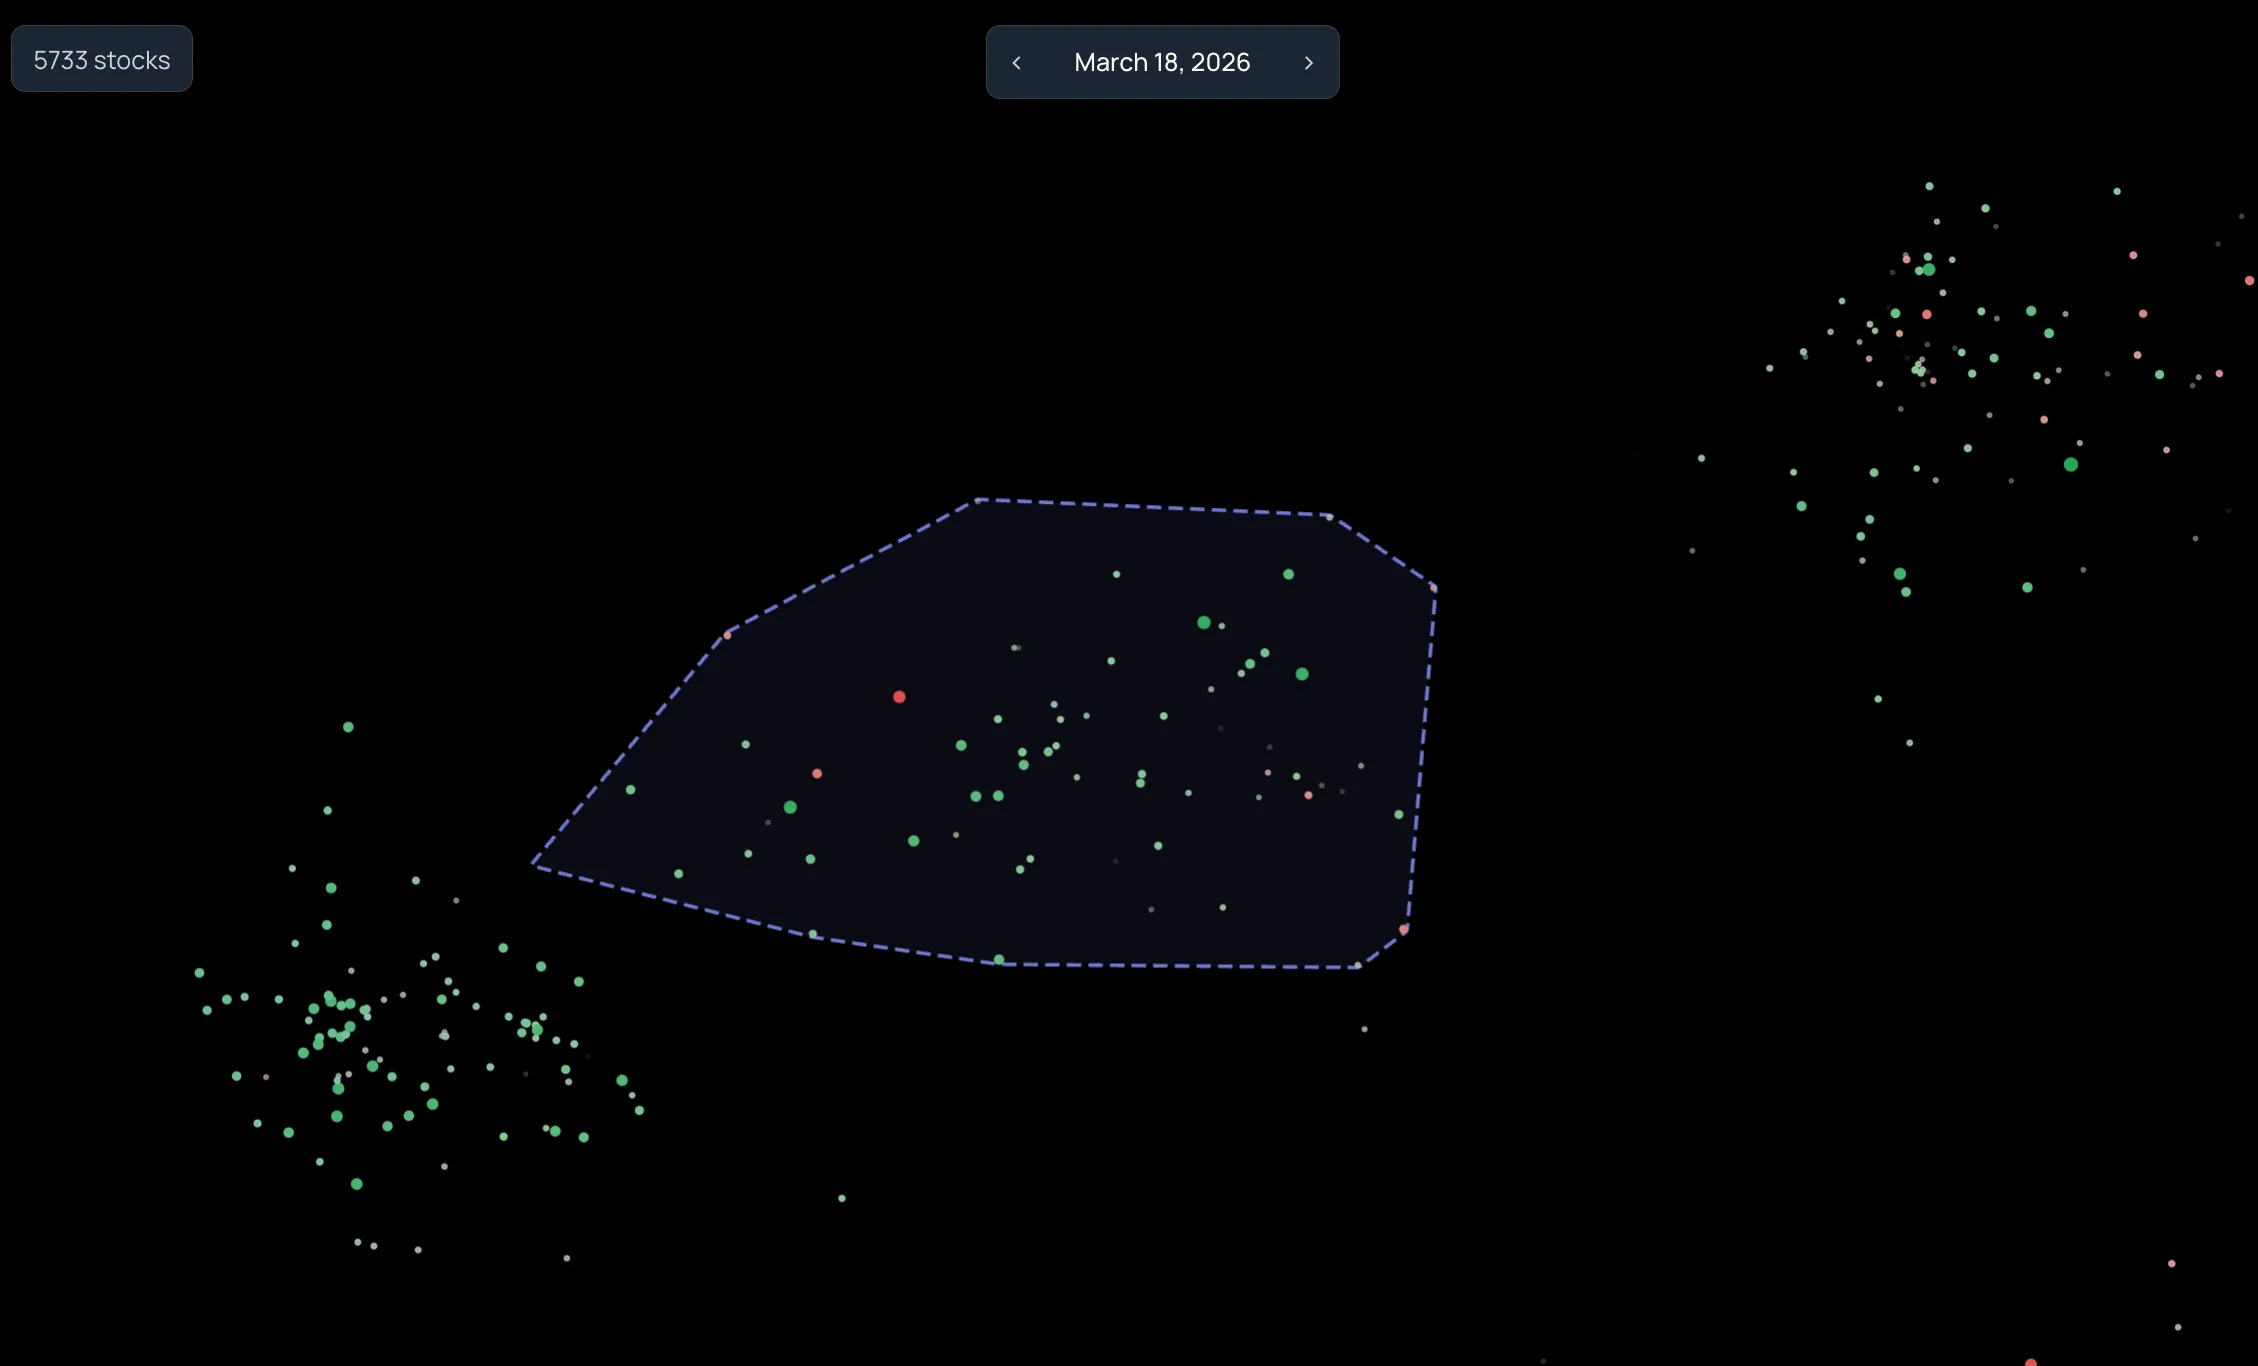
On this date most of the market was tinted red. One region on the far left was almost entirely green. That contrast is the observation: a group of instruments whose returns are related to each other behaved differently from everything around them.
Before calling it "positive," check what Body Color is measuring. Here it was price change scaled by historical standard deviation, not a raw percentage.
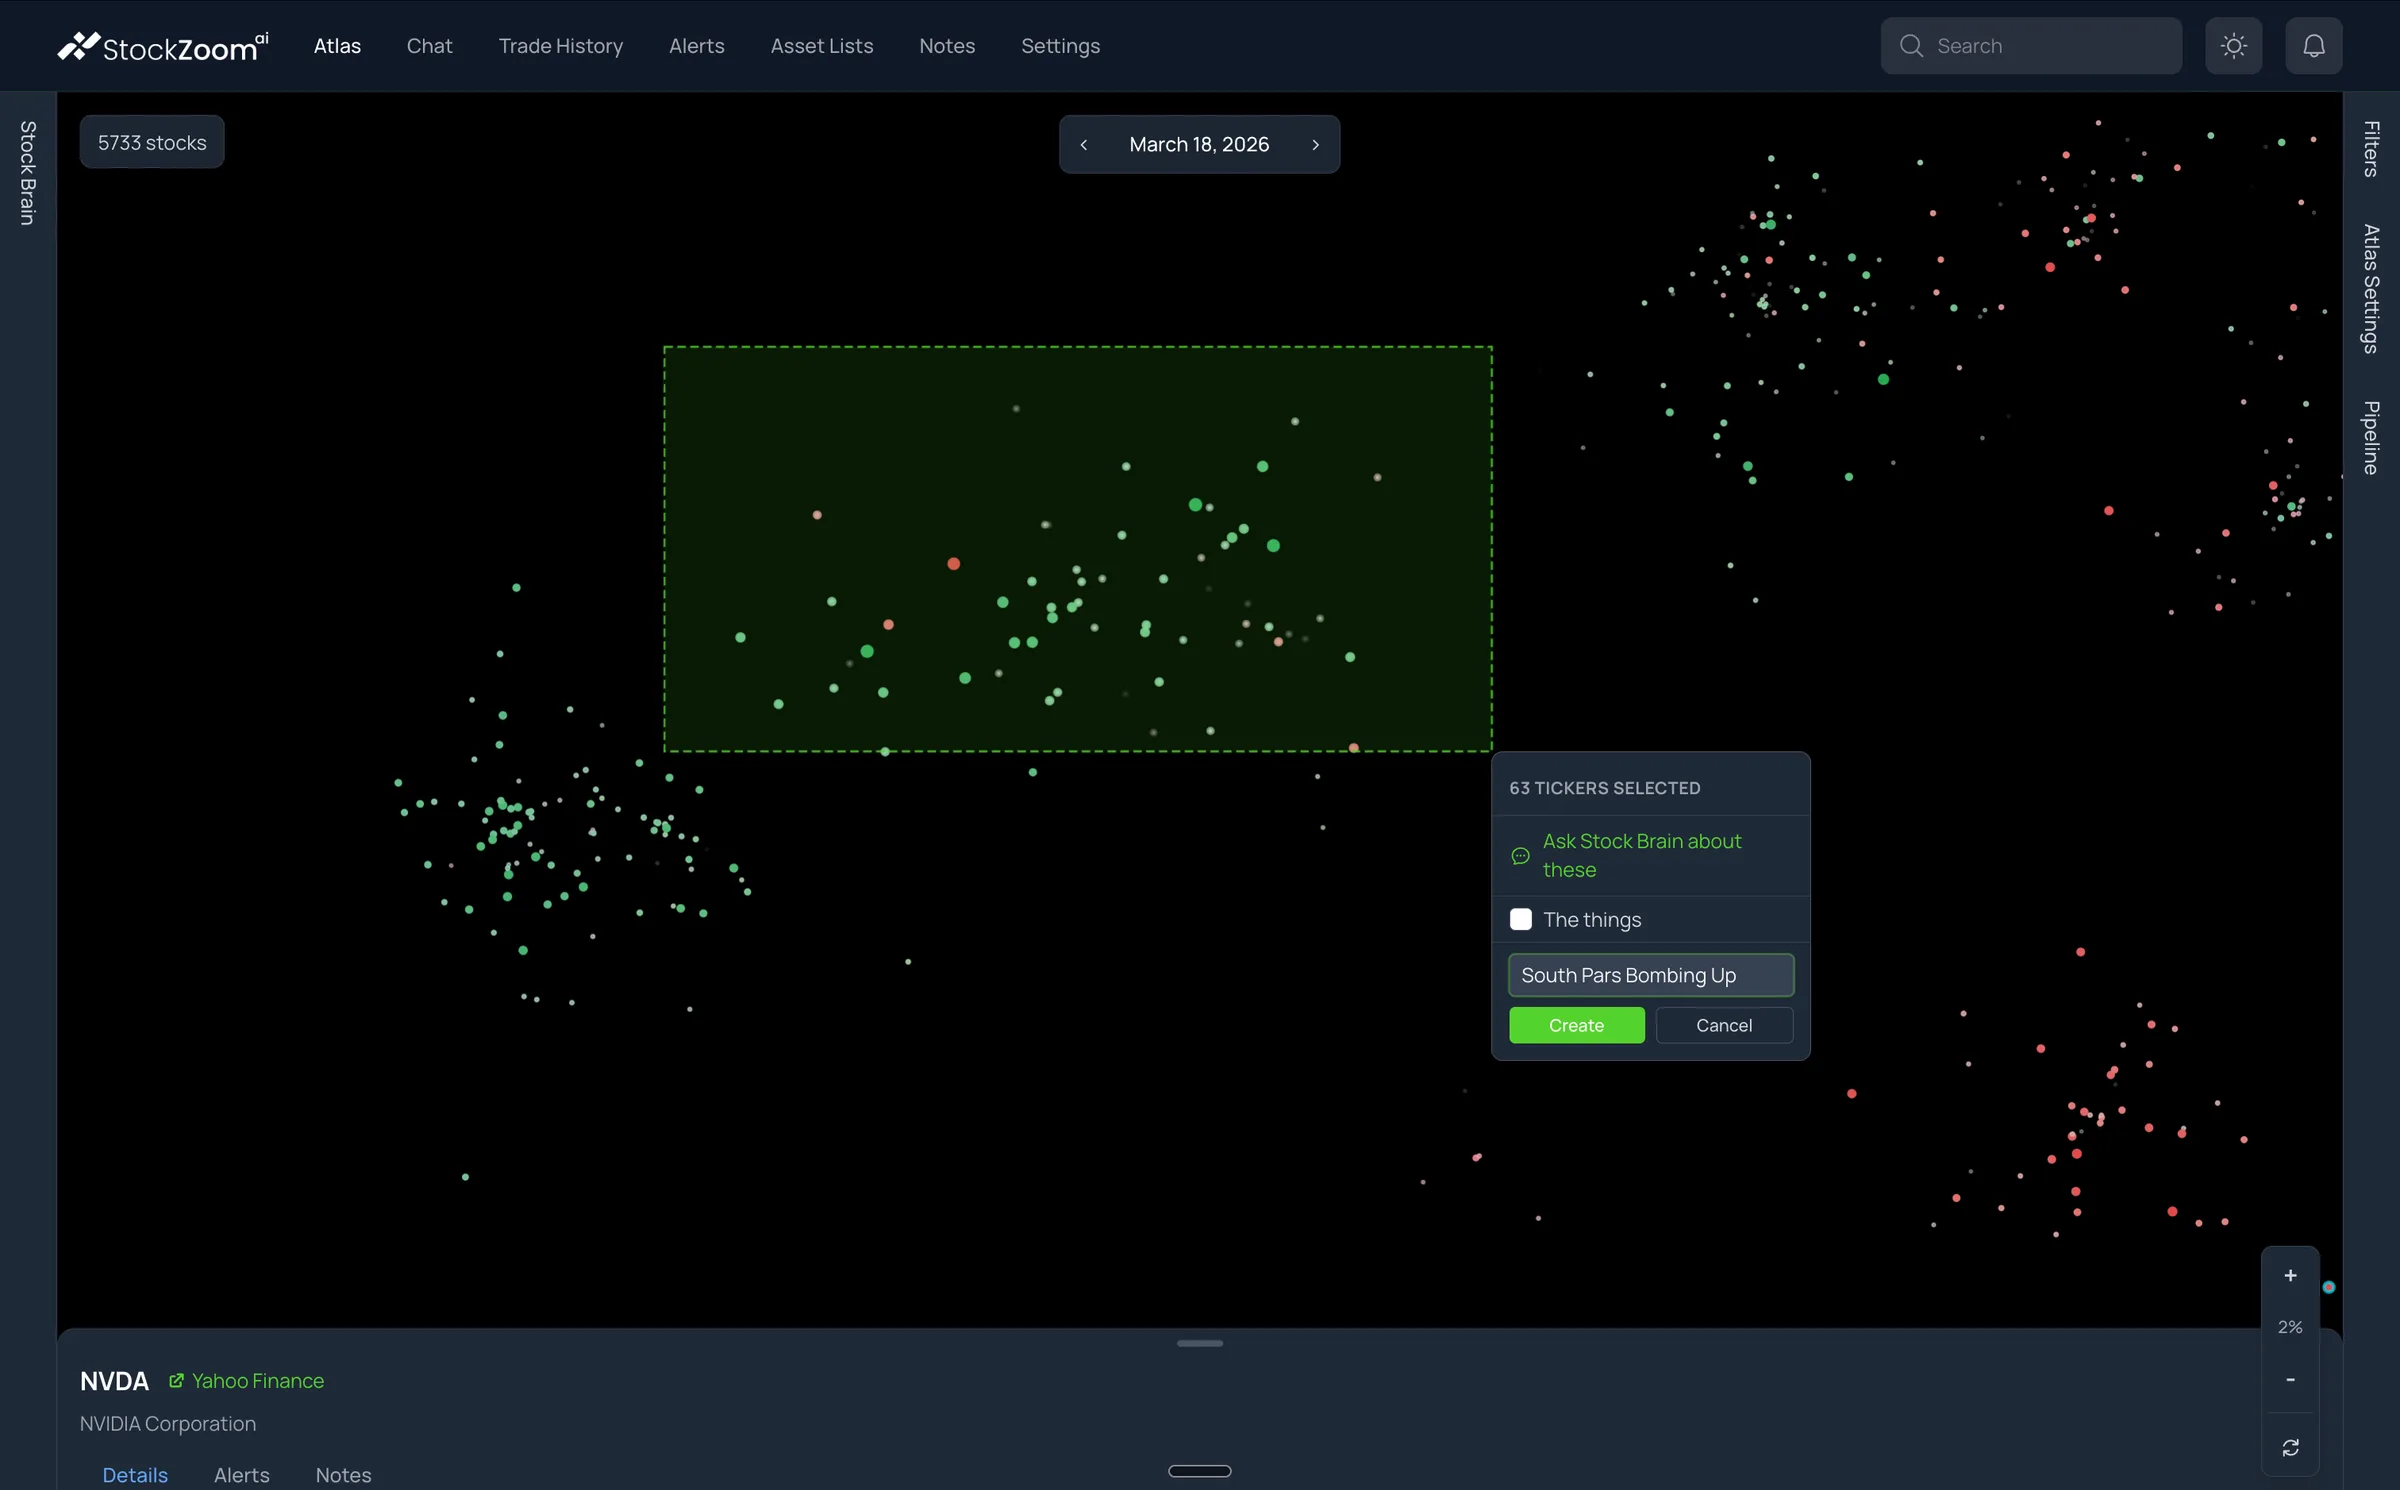
Select the region and save it.
Zoom in until the dots are distinct, hold Shift, and drag a rectangle around the region. The selection menu reports the count. Choose New list, type a name, and press Create. The symbols are now in Asset Lists.
A rectangle is a blunt instrument. The 63 here include a few red and faint circles. The next step is to open Asset Lists and prune what you did not mean to keep.
Review the list in context.
Check the list in Filters, keep Correlation Clusters on, and turn on Asset List Boundaries in Atlas Settings. The outline shows the set you saved while the surrounding market stays visible.
The researcher reported members including WTI, LNG, and XOP, along with other oil-and-gas and inverse-market instruments. Several were names they had not thought to search for. Each one now gets ordinary research: what it is, how it is structured, what else could explain the move.
The workflow, not a forecast.
Broad market, a chosen date, a region with a shared pattern, a spatial selection, a named list. That is the whole product loop, and it produced a manageable starting set without supplying a single ticker in advance.
It does not establish that the event caused the move, that the pattern will repeat, or that the list is a portfolio. Those are the questions the list exists to help you research.
A worksheet for repeating it
Keep these in your own notes so a session can be reproduced.
| Research question | The pattern or possible explanation you want to examine |
|---|---|
| Event evidence | Source, reported timestamp, timezone, and relation to the trading session |
| Comparison dates | Every date you looked at, including the ones that did not support the idea |
| Visual configuration | All four metrics, their thresholds, and the layout settings |
| Selection | Region description, selected count, and the verified list members |
| Observation | What changed on the map, stated without a causal conclusion |
| Alternative explanations | Other events or company-specific developments to rule out |
| Next step | What you need to know before making any decision |