Watch the entire stock market on a single screen and never miss a developing market trend
We built this tool to help you spot major movement in segments of the market sooner, so that you catch more of the upward movement.

Looking at individual stocks gives you tunnel vision. For example, you might see NVIDIA but miss Supermicro or Micron. Our tool helps you see movement in clusters of stocks so that you never miss major market trends, like AI, quantum computing, and the next big thing.
These explosions in market value affect dozens of companies at the same time. We wanted a tool that can visualize these booms as they begin. That's why we built StockAtlas.
Why we feel this visualization helps you find opportunities in the market.
Most visualization tools focus on individual stock charts.
But staring at an NVIDIA chart isn't going to help you find Micron.
And staring at charts of AI companies all day won't tell you when solid-state batteries or quantum computing start to explode.
We were tired of looking at one area of the market, only to notice that while we were focused there, another part of the market started to boom.
But can't you just read market news?
No. By the time an asset or a set of assets shows up in your feed, it's because it has already exploded.
It makes sense, right? An asset, or a set of assets, is not newsworthy until it has already experienced the explosion. Otherwise it's boring news.
Therefore, by the time any asset shows up in your news feed, the move has already happened.
What about just subscribing to stock newsletters?
Stock newsletters can help, especially if you primarily want someone else to tell you where to invest or what they personally notice.
But they might miss something you would have noticed watching the entire market yourself.
And unless they're using a tool like StockAtlas to send you up-to-date snapshots of market movement at the cluster level, they're typically giving you only a few picks that caught their eye, or pointing you at a handful of stocks in a sector. You have no good way to tell whether those are all the assets of interest, or whether they missed dozens of other correlated assets.
So you're still just as likely to miss relevant cluster-level movement.
That's why newsletters are an excellent supplement to StockAtlas, but not a great replacement.
What about signals?
Signals are similar to newsletters in that they tend to focus on individual assets.
The problem with signals tracking a single stock
Signals for individual stocks are likely to notify you about one-off events, or trends isolated to a single company.
But you're generally better off researching a trend that is part of a broader boom, and not just because a certain company announced a share buyback today.
For example, when all of the quantum stocks are booming, the trend shows up across many companies at once.
But when you get a signal for a single stock, it's like putting all of your money on one number in a game of roulette. So much can go wrong for that individual stock.
The problem with signals spanning a large or filtered set of stocks
Another problem with signals is noise.
If the set of stocks monitored is too large, you get lost trying to keep track of it all, or you burn out trying to keep up.
So either you subscribe to signals for only the assets you're interested in and miss the ones you left out, or you get a deluge of signals that you end up ignoring because of alert fatigue.
StockAtlas takes advantage of the brain's ability to process lots of visual information. It's like looking at the night sky.
One reason StockAtlas is better than newsletters or signals alone is that, while humans don't like sifting through lots of text, the brain is really, really good at processing visual information.
Think about how many times you've looked up at the night sky and noticed something abnormal that caught your attention.
Your brain does it easily. And it never really gets old.
Also, the more you look at the same visual, the better you get at spotting an anomaly: something that looks different than it's supposed to.
That's why we designed StockAtlas to keep asset clusters, and the assets within them, in stable locations on the map.
StockAtlas lets you quickly take in the entire universe of assets and spot the outliers, and the changes from one time period to the next.
Join the waitlist
Direct registration is coming. For now you have to join the wait list.
Note: You should join the wait list now, even if you're not entirely sold, because it's free. Also, access will be granted on a first-come, first-serve basis. You can always decline your spot. But, if you're not on the wait list or you're at the very bottom of the list, you have little-to-no chance of getting a seat. We only opened the wait list on October 3rd. So, if you join the list today, you're likely not too late.
Also, while it's true we have fewer than 9 seats left right now, we will open up more seats at some point in the future. We just haven't decided when.
The reason is that we're trying to stage the rollout so that we don't overwhelm our ability to support those who are first to get access.
Also, if we give too many access to the tool it sort of dilutes your market advantage. So we do plan to permanently restrict access to a smaller set of subscribers. And, once we hit a number we're comfortable with, we'll only make new seats available if an existing subscriber gives up their seat.
Next steps: After you join the wait list (and if we still have seats left) we will reach out to you with instructions on how you can place a deposit to reserve a guaranteed seat or alternatively, how you can purchase lifetime access if that interests you.
StockAtlas provides two views to help you find fast-moving asset clusters.
You can view asset clusters in two ways: collapsed and scattered.
When should you use scattered view?
In scattered view you can see every asset as a single point in the market universe. This is useful when only parts of a cluster are experiencing rapid growth and you want to find research candidates by looking at exactly which parts.
For example, among a cluster of memory manufacturer stocks, maybe only those that sell High Bandwidth Memory (like Micron and SK Hynix) are booming.
In a similar vein, scattered view helps when a handful of stocks in a cluster are dragging down the collective metrics for that cluster.
In both cases, scattered view lets you see those details for yourself and notice the trend.
When should you use collapsed view?
Scattered view can be too much information all at once.
It can also hide the relative scale of a fast-moving trend in a sub-section of the market.
The collapsed cluster view gives you collective performance metrics for the entire cluster, computed together. This gives you a better sense of the relative scale of price movement in a section of the market.
What you get as a StockAtlas subscriber.
-
01
Full access to the universe of 5,733 assets we analyze and process.
To build your visualization we process more than 36 million individual data points. As a subscriber you get access to the results of that analysis.
-
02
The ability to re-compute clusters on demand.
The set of clusters is not fixed for all users. You can regenerate clusters whenever you want, so that you can view the market from a different angle.
For example, maybe you want to analyze the recent AI memory boom to spot related companies that haven't moved with the group. You can pick a time window that lines up with the start of that boom and regenerate clusters. Doing so lets you search for clusters that newly formed around that timeframe. Now you have a set of companies to research without relying on the same headlines everyone else is reading. In general, by the time the press is writing an article about a company, the move is often already well underway.
Cluster regeneration is limited to a certain number of regenerations each day, because each cluster generation takes billions of compute cycles. Reach out to us for custom pricing if you want unlimited cluster regeneration.
-
03
First access to new products.
StockAtlas is only the beginning. We have exciting new products in the pipeline that build on asset correlation and on identifying statistically significant moves among clusters of co-moving assets. As an existing subscriber you get first right of refusal on new products before we give your seat away to someone else.
-
04
Support via a weekly Zoom meeting for all customers.
Come to the weekly Zoom meeting and ask us questions, discuss new features you want to request, or talk about market observations. At these weekly sessions we also talk about some of the trends we're noticing as we use StockAtlas ourselves. This is another reason we limit the number of subscribers: so that you have access to us, the founders, to ask your questions or share your thoughts.
-
05
Priority to request new features at any time.
How many stock visualization services are you aware of that let their subscribers directly request new features to improve their stock-finding workflow? One of the reasons we don't want too many customers is so that our customers get white-glove service. That includes being able to ask for features and getting rapid turnaround on your requests.
-
06
Regular training to help you get more out of StockAtlas.
Every three months, subscribers get free training on the newest StockAtlas features and how to use them to spot emerging trends even faster than before. We fully understand that we have to keep shortening time-to-discovery.
StockAtlas covers nearly all stocks and ETFs traded on American markets.
5,700+ assets across United States financial markets.
StockAtlas covers nearly the entire United States stock and ETF universe so that you never miss movements in assets you can trade.
As of this writing, StockAtlas allows you to visualize and monitor the movements of 4,596 stocks and 1,137 ETFs.
See the full list of assets StockAtlas analyzes.
Here is a brief explanation of how to understand and use the atlas.
We know this is a new way of looking at the market. So you probably have many questions. Below we do our best to explain how you use this visualization to spot market trends faster. You can also contact us to get a demo if you'd like a guided walkthrough. We'd love to understand your questions so that we can improve the explanation on the site for you and others who likely have the very same questions!
Stocks whose returns move together sit together.
StockAtlas builds its groups from historical return relationships across the whole instrument universe. Two companies with different industry labels can land in the same neighborhood if their returns have tended to move together.
The axes are not price, size, or valuation. Position means relationship context. The exact pixel distance between two dots is not a correlation score, but the region a dot sits in tells you which instruments have behaved like it.
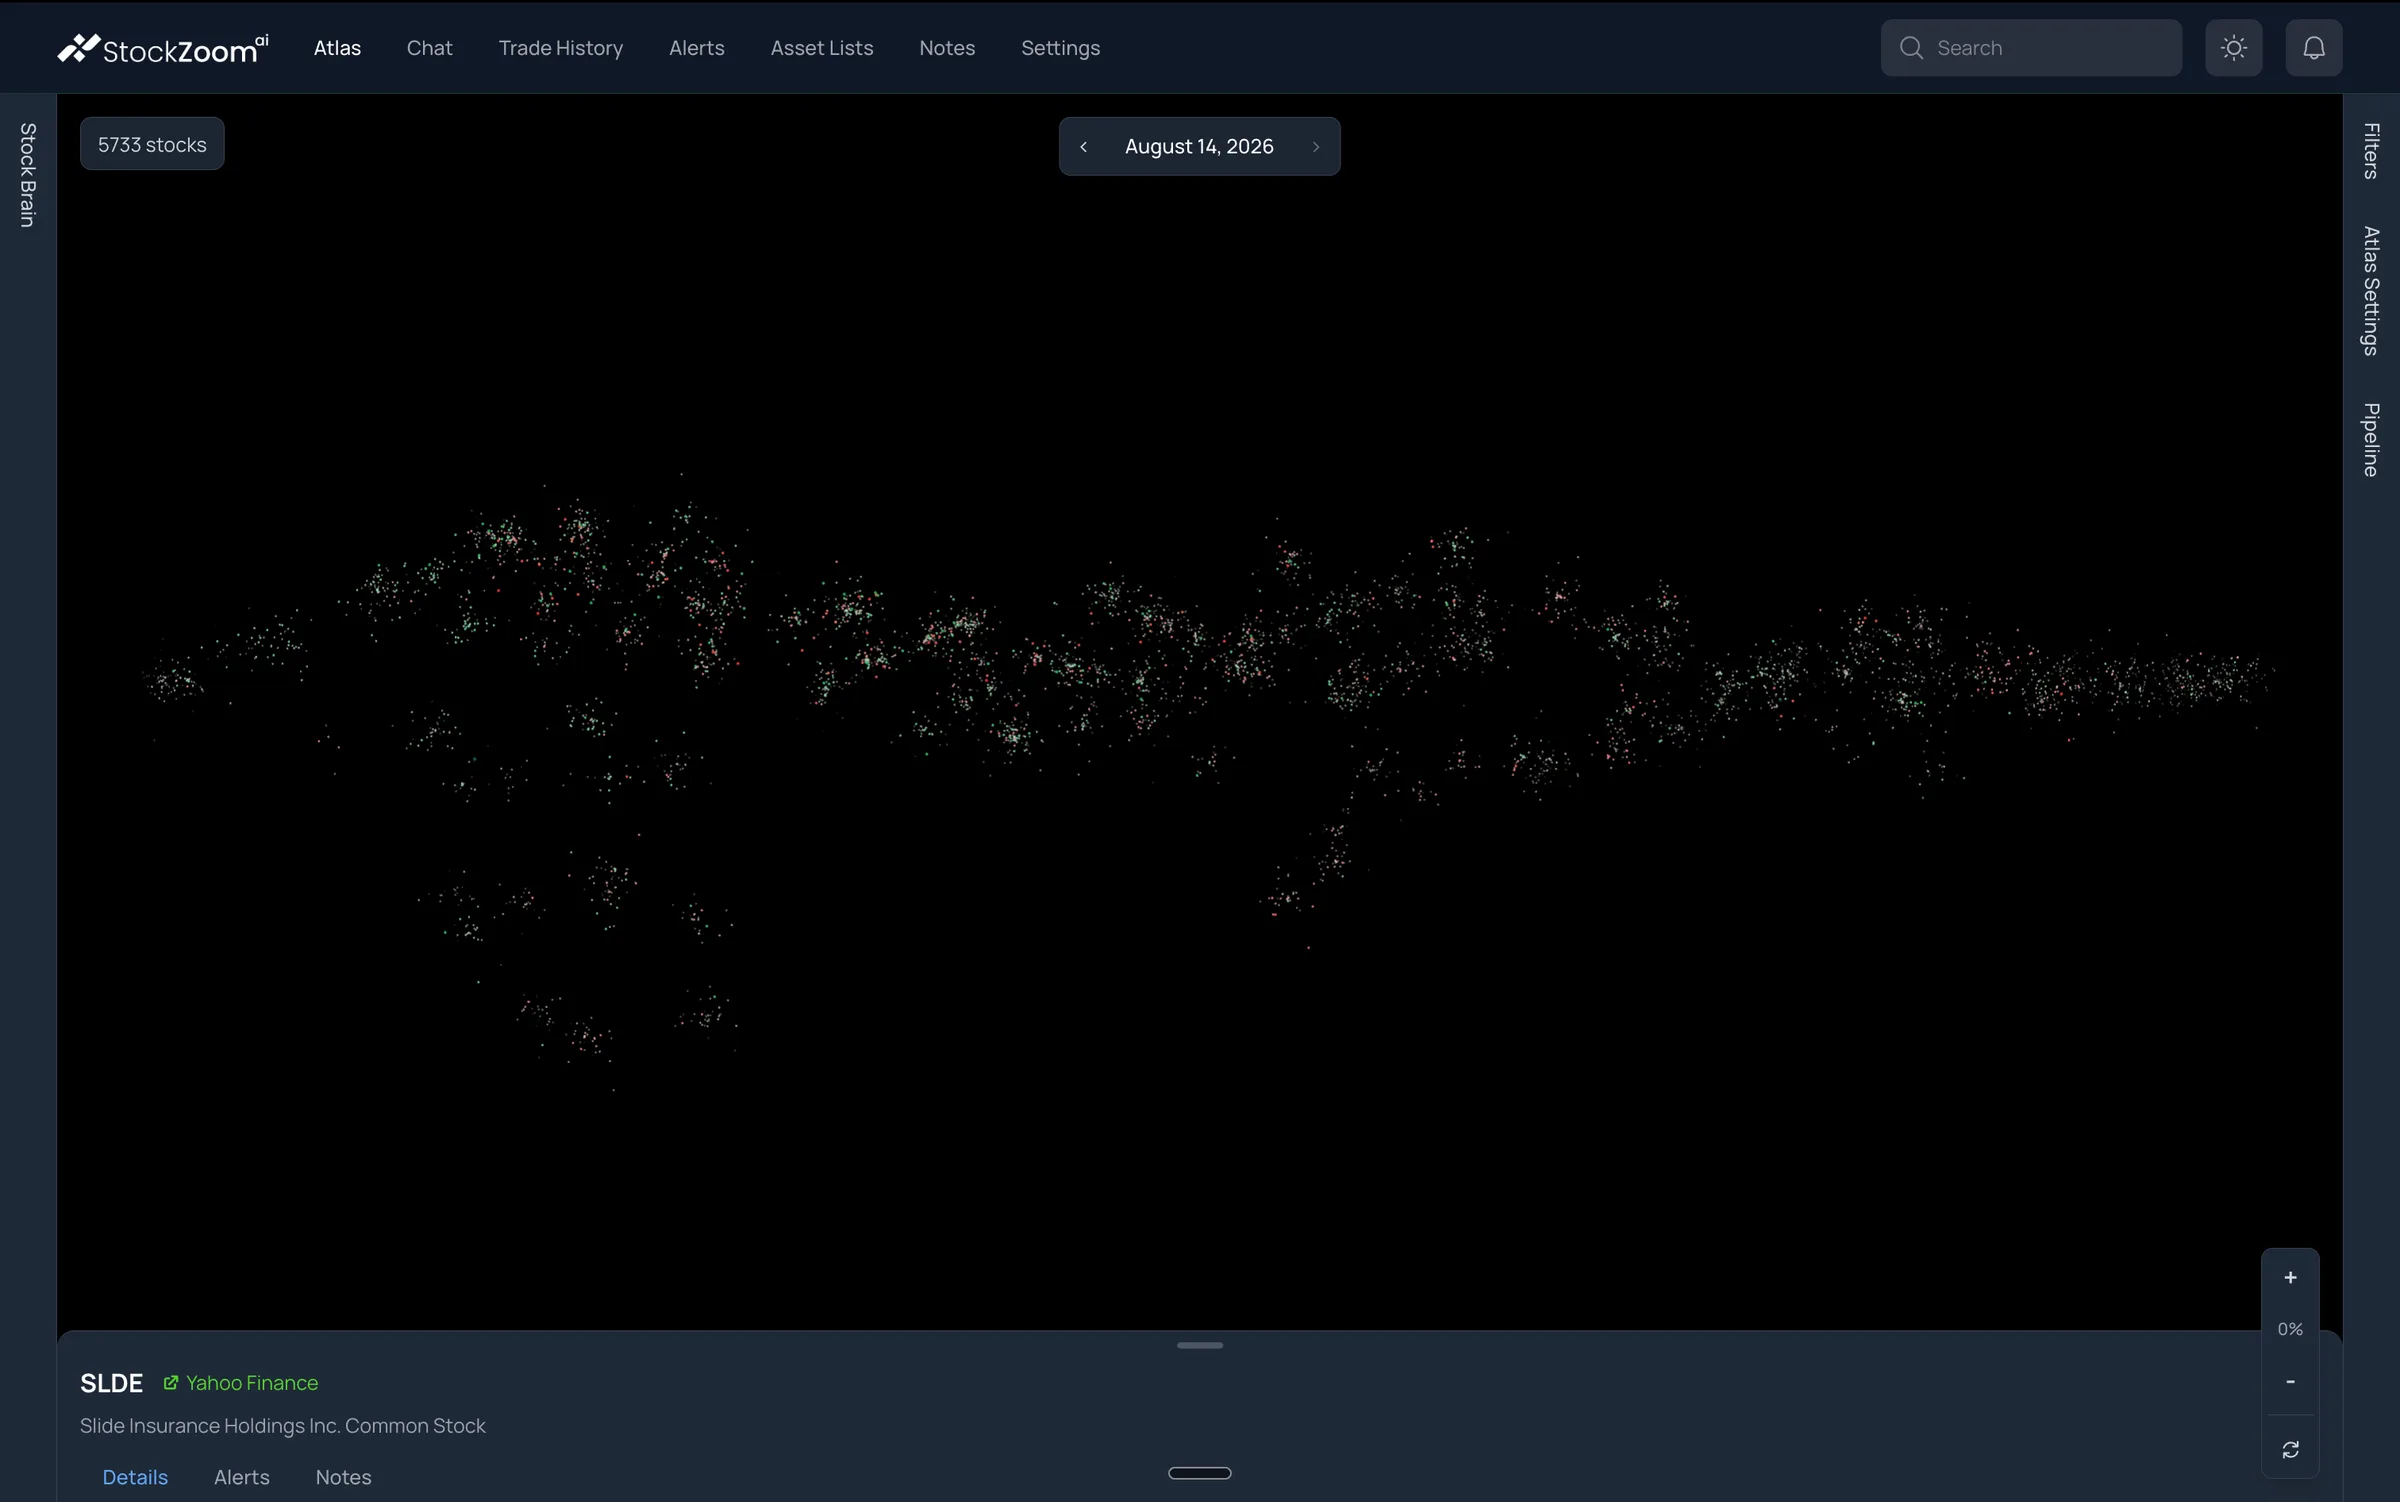
- 1The whole universe 5,733 instruments on this date. Nothing is filtered out yet.
- 2A dense region Instruments whose returns have moved together. Groups form on their own.
- 3A historical snapshot The view is tied to a stored date. Step through dates with the arrows.
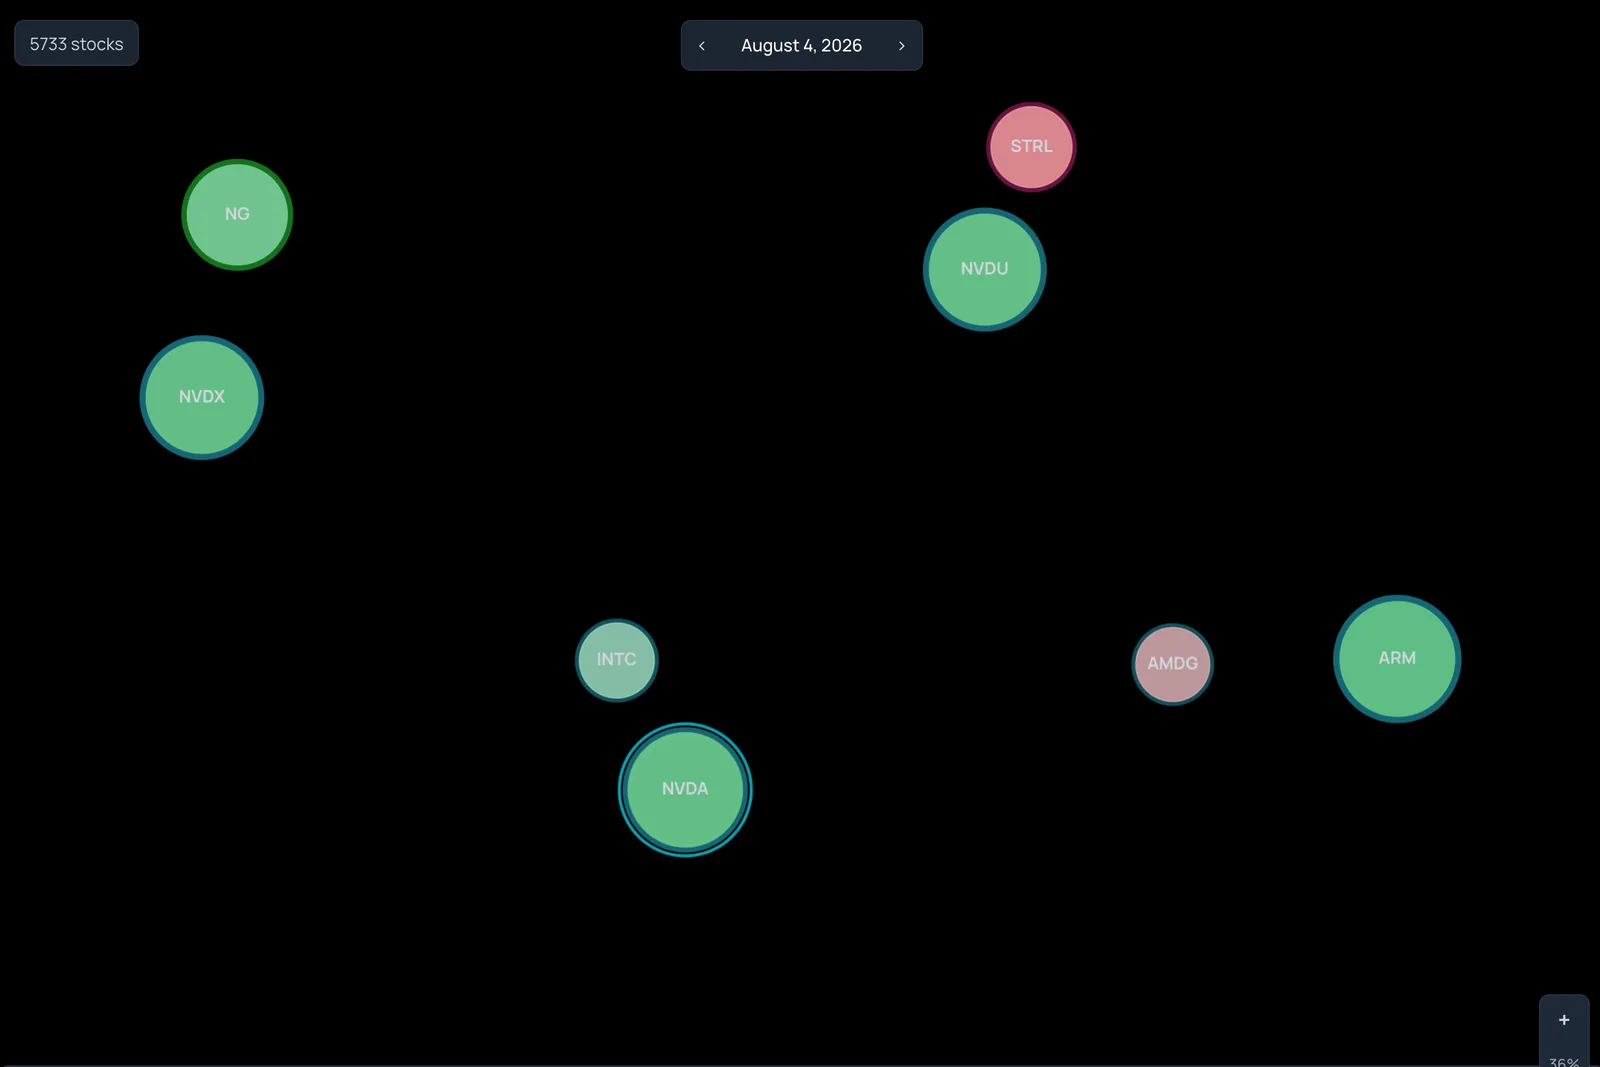
- 1Body color Green or red for the sign of the selected metric. Here: price change in standard deviations.
- 2Border color A second metric gets its own color, so one circle can carry two readings.
- 3Faint means near neutral Opacity fades instruments whose score sits inside the threshold you set.
Appearance carries the measurement you choose.
Position is fixed by relationships. Everything else about a circle is yours to assign. Body color, border color, size, and opacity each take their own metric and threshold, so a single view can answer more than one question at once.
A green circle is not a buy signal. It is a positive score on the metric you picked for Body Color. Change the metric, press Render, and the same map shows you something new.
Zoom from the whole market to a single company.
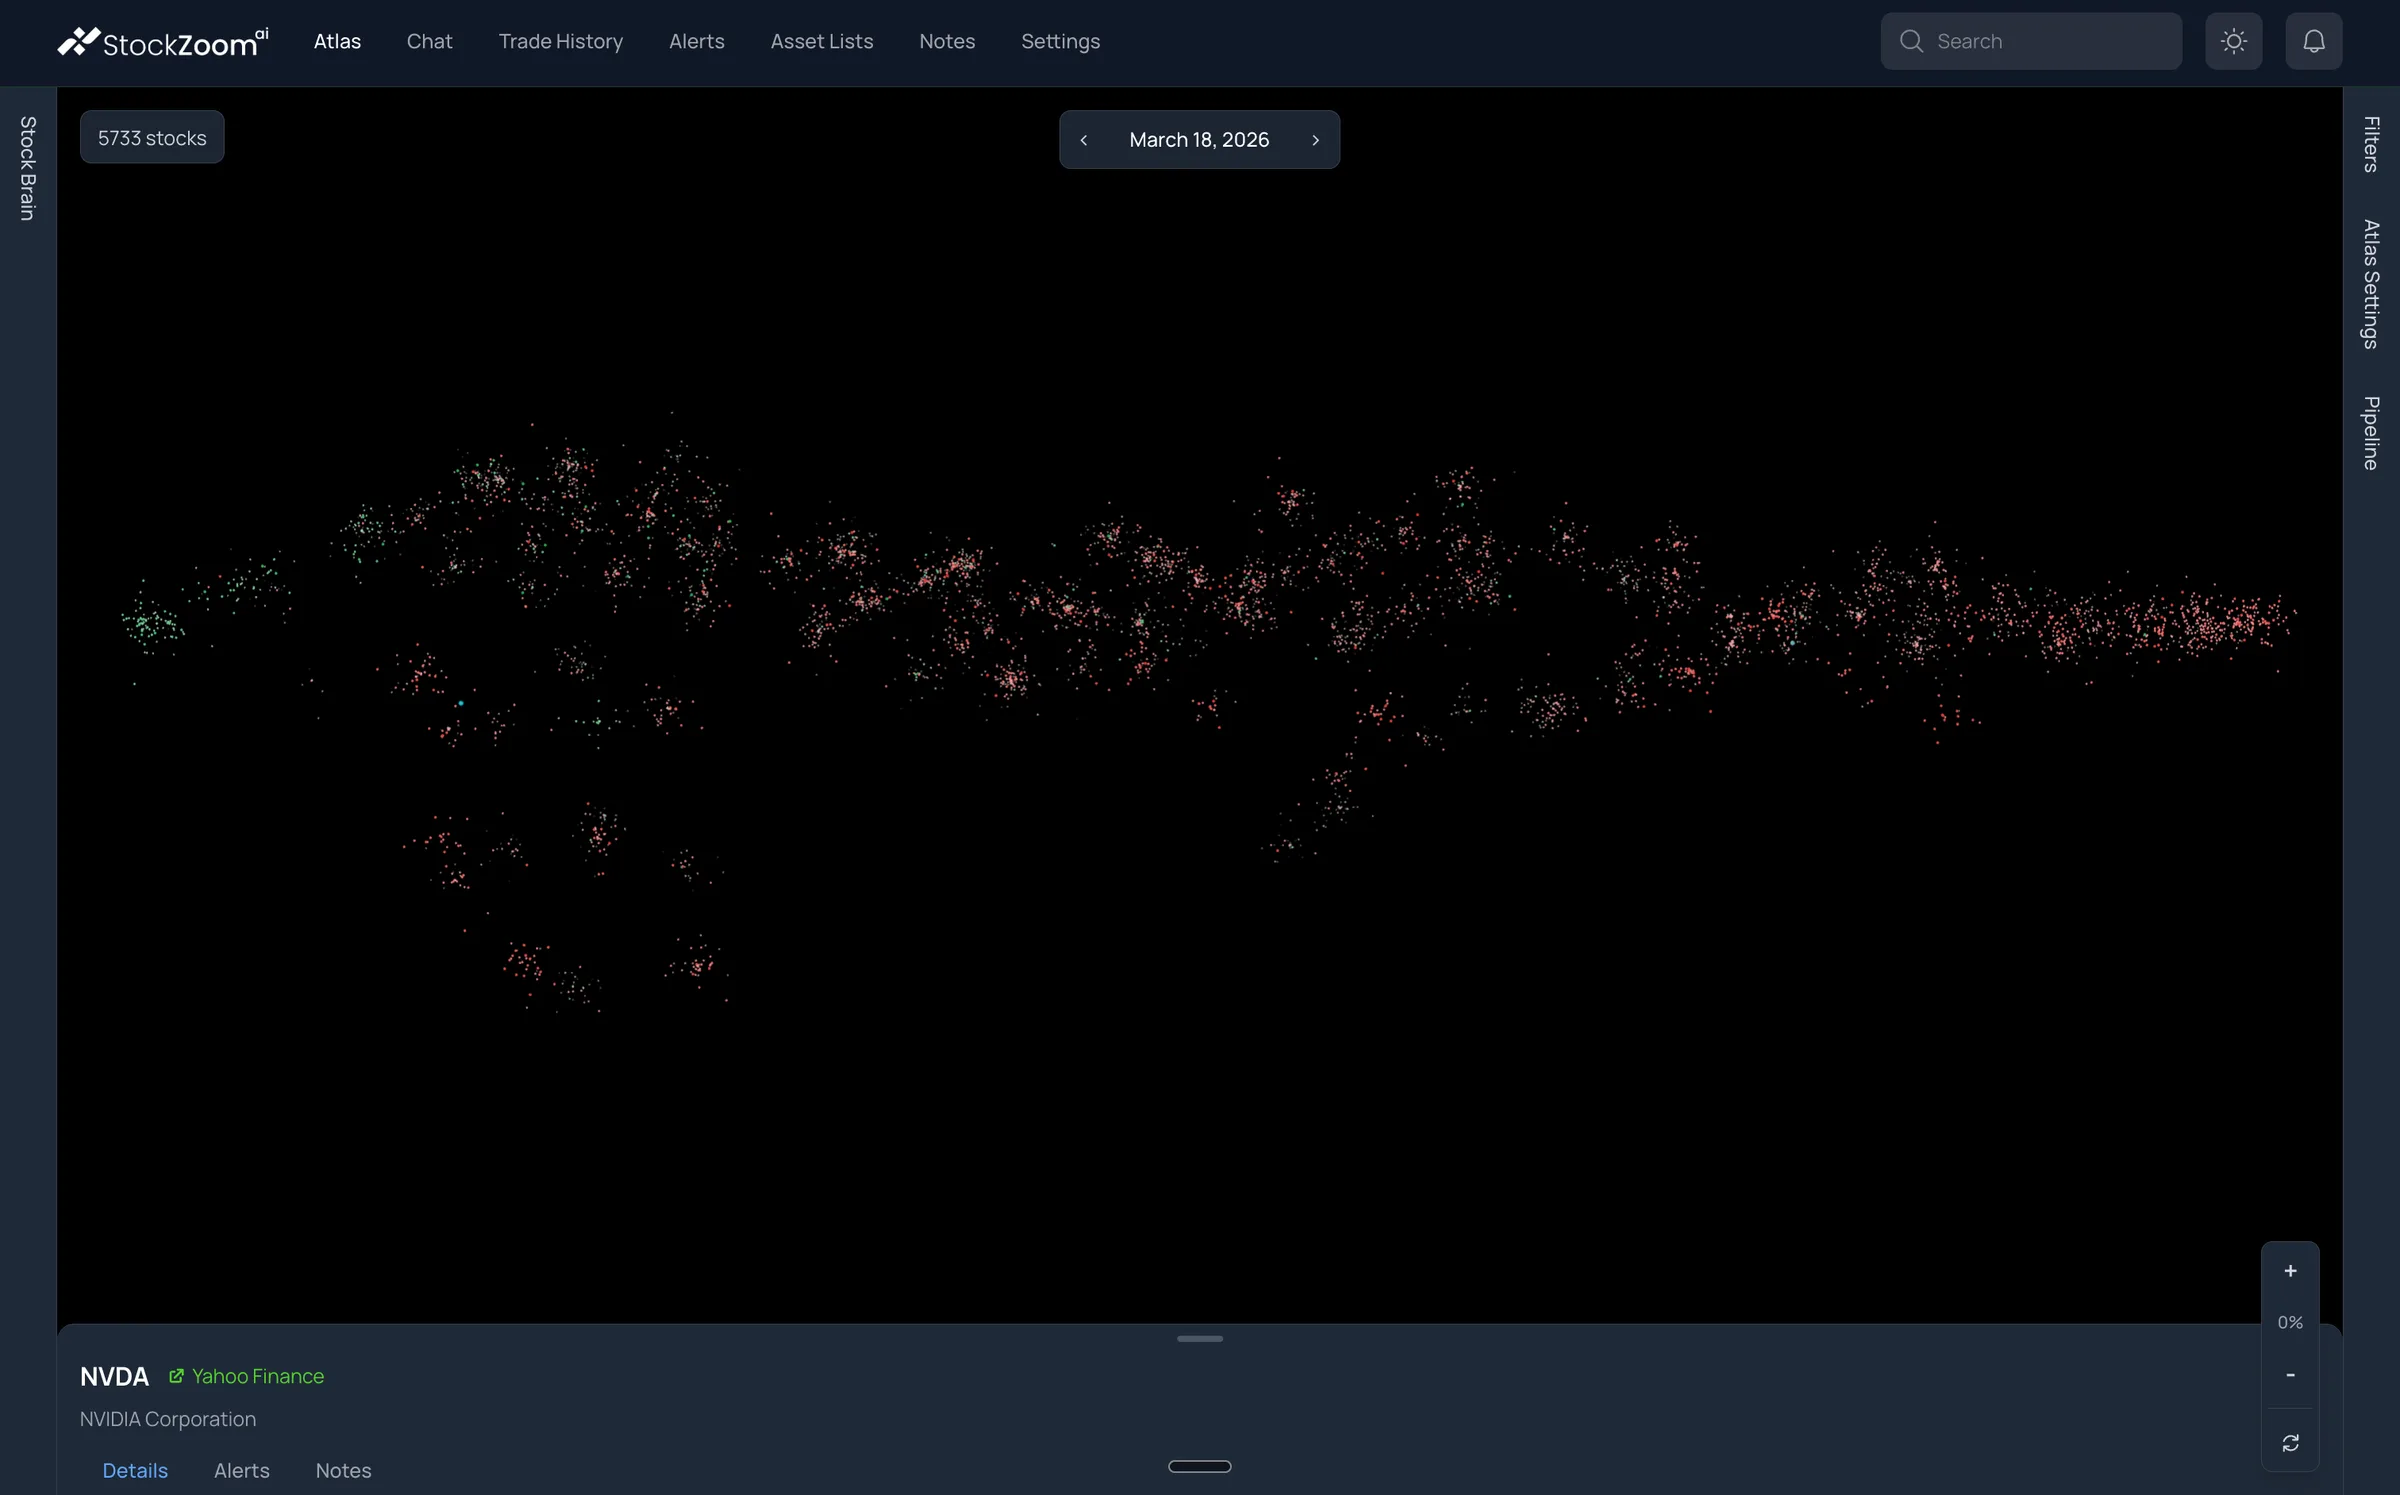
Start at 0% and the market is a field of dots. Scroll in and groups resolve into circles, circles grow labels, and a click opens the details drawer for any instrument. The geography does not change as you zoom, so you always know where you are.
Can you answer this question? Tell us in the live chat.
Are you aware of any other application that allows you to watch the entire market as co-moving clusters, so that you never miss a trend in a set of assets as soon as it happens?
We're not aware of any. But if you are, message us in the live chat. We'd like to know.
From the whole market to a list you can research.
One session in StockAtlas moves through four stages. Each one is a real screen, not a diagram.
Start with the whole market.
Open Atlas on any available date and keep Correlation Clusters on. Every instrument in the dataset is on screen at once. You do not need a ticker, a sector, or a screening rule to begin.
If the latest date looks sparse, step back a few weeks to a fully populated one.
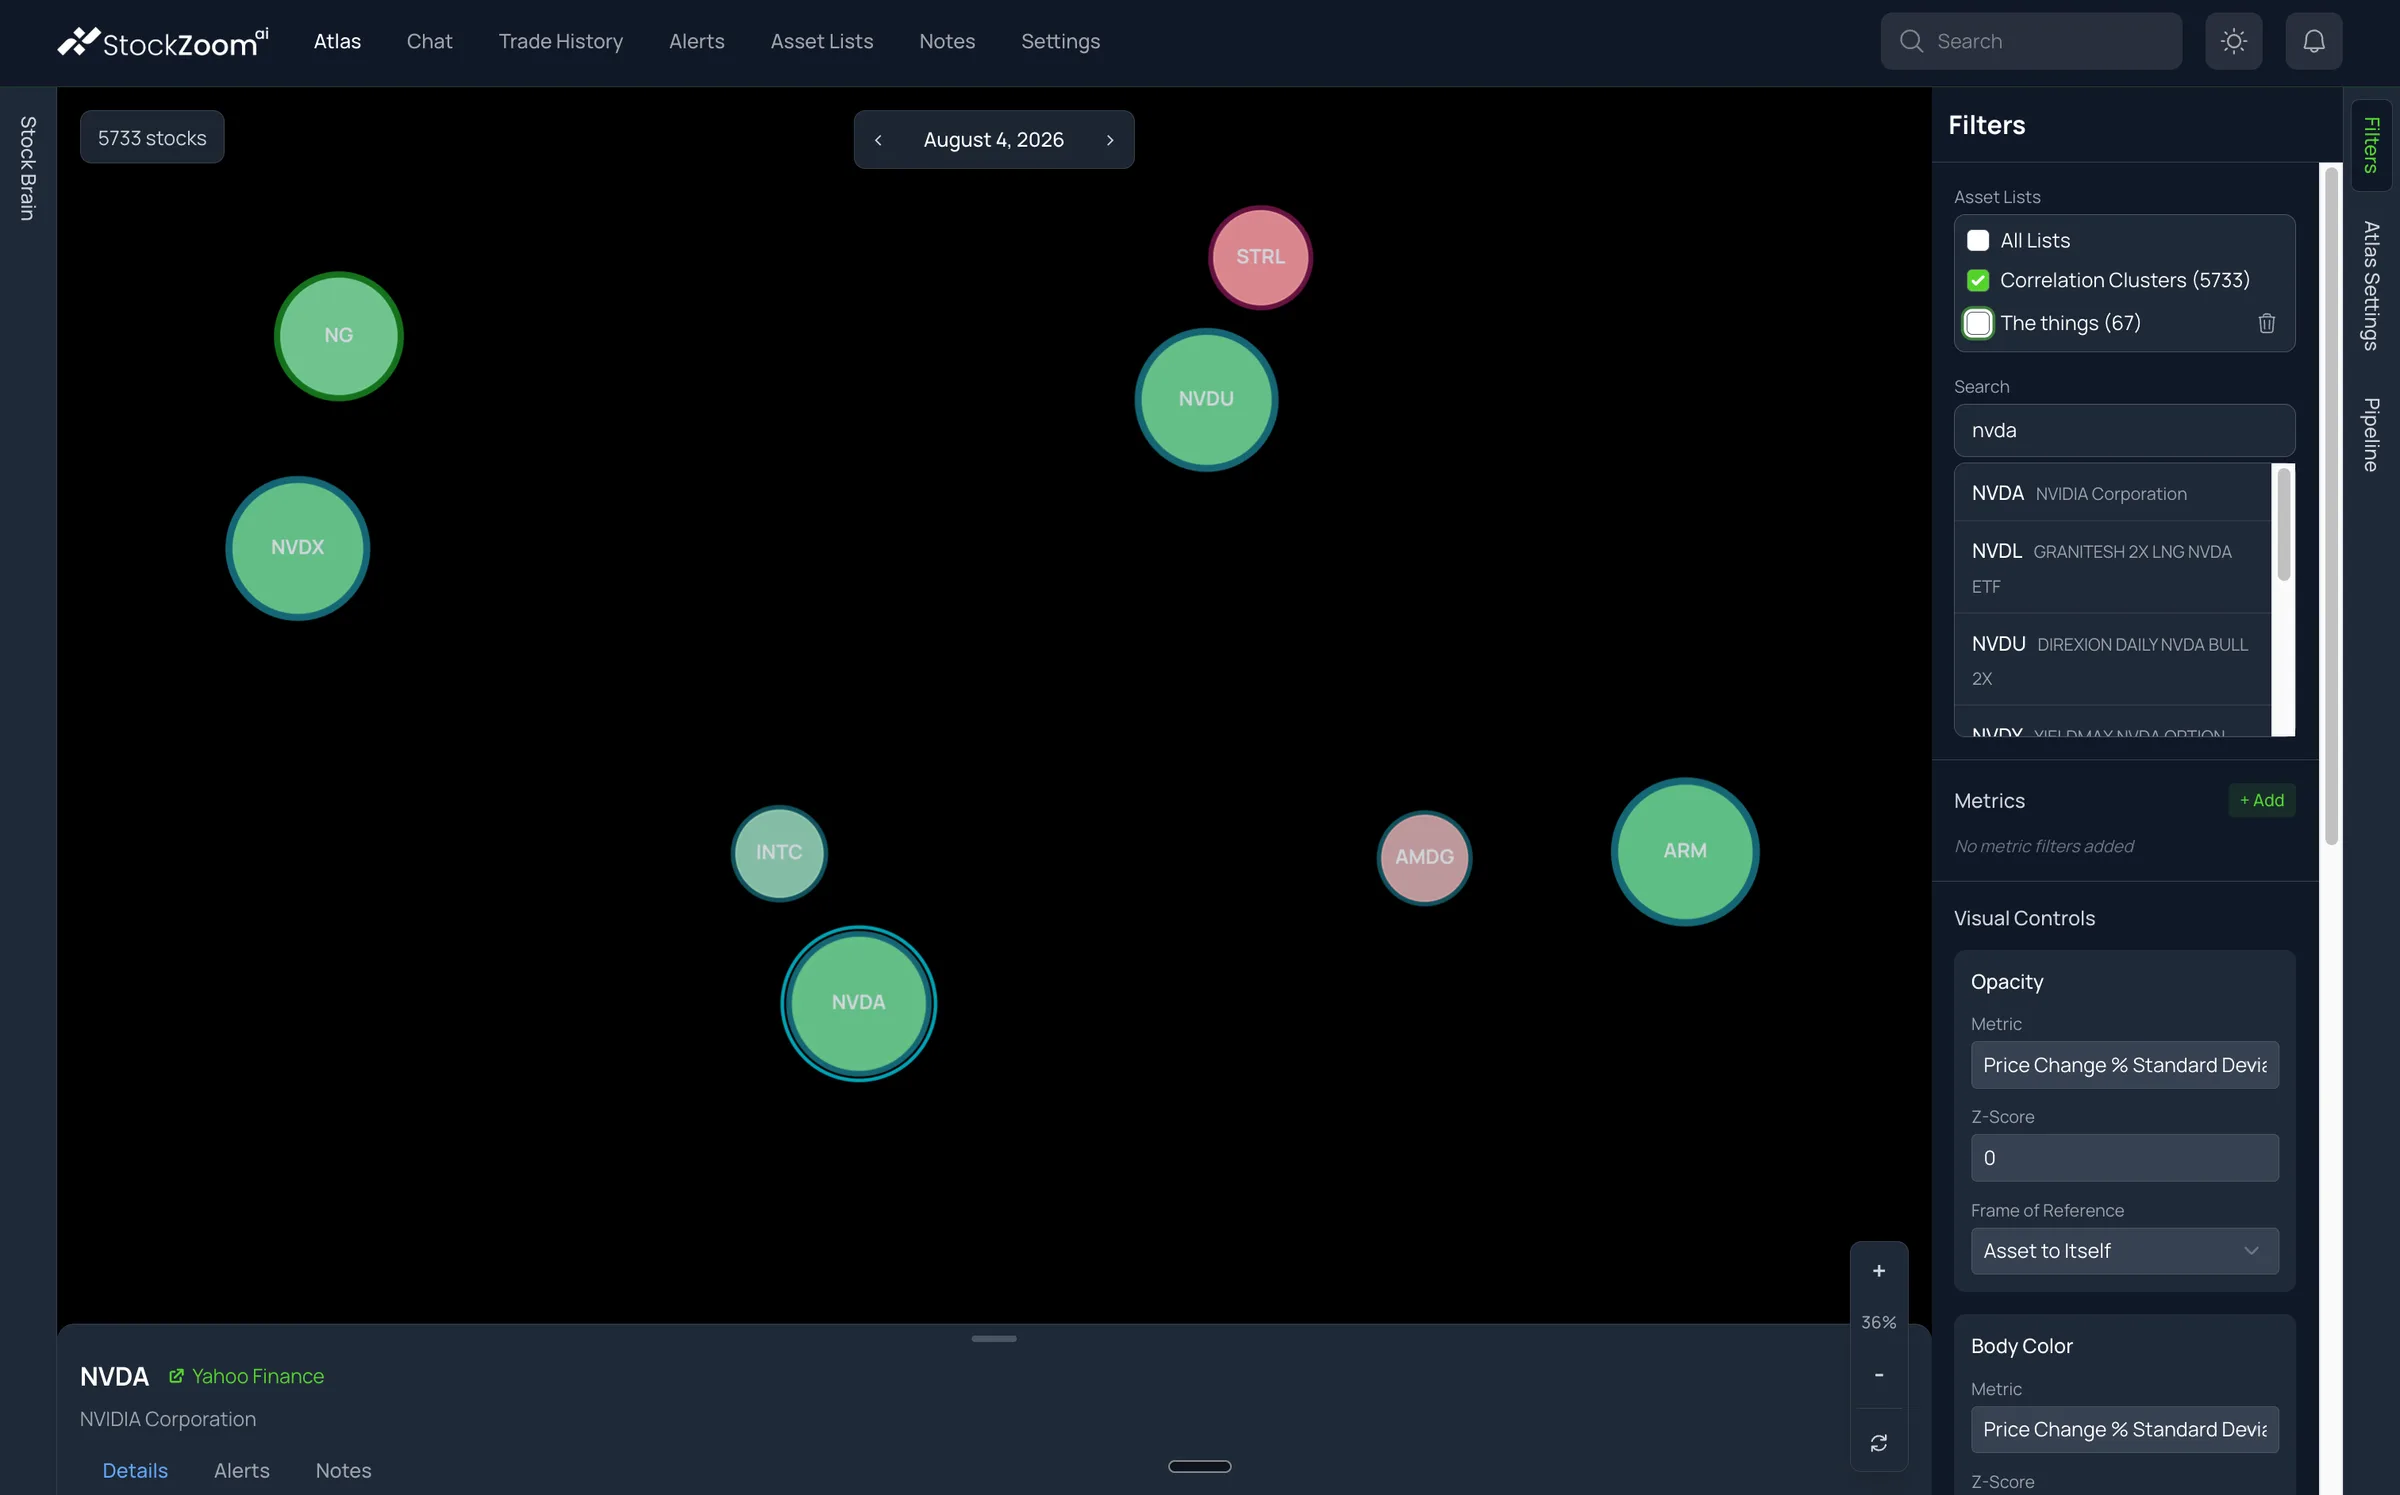
See what moves with NVIDIA.
Pan and zoom until a group catches your attention, or type a ticker you already know into Search and jump straight to its neighborhood. Choose which metric drives color, size, opacity, and border, then press Render.
Search results include stocks and funds, so a company and the ETFs built around it show up together.
Tune what the map shows you.
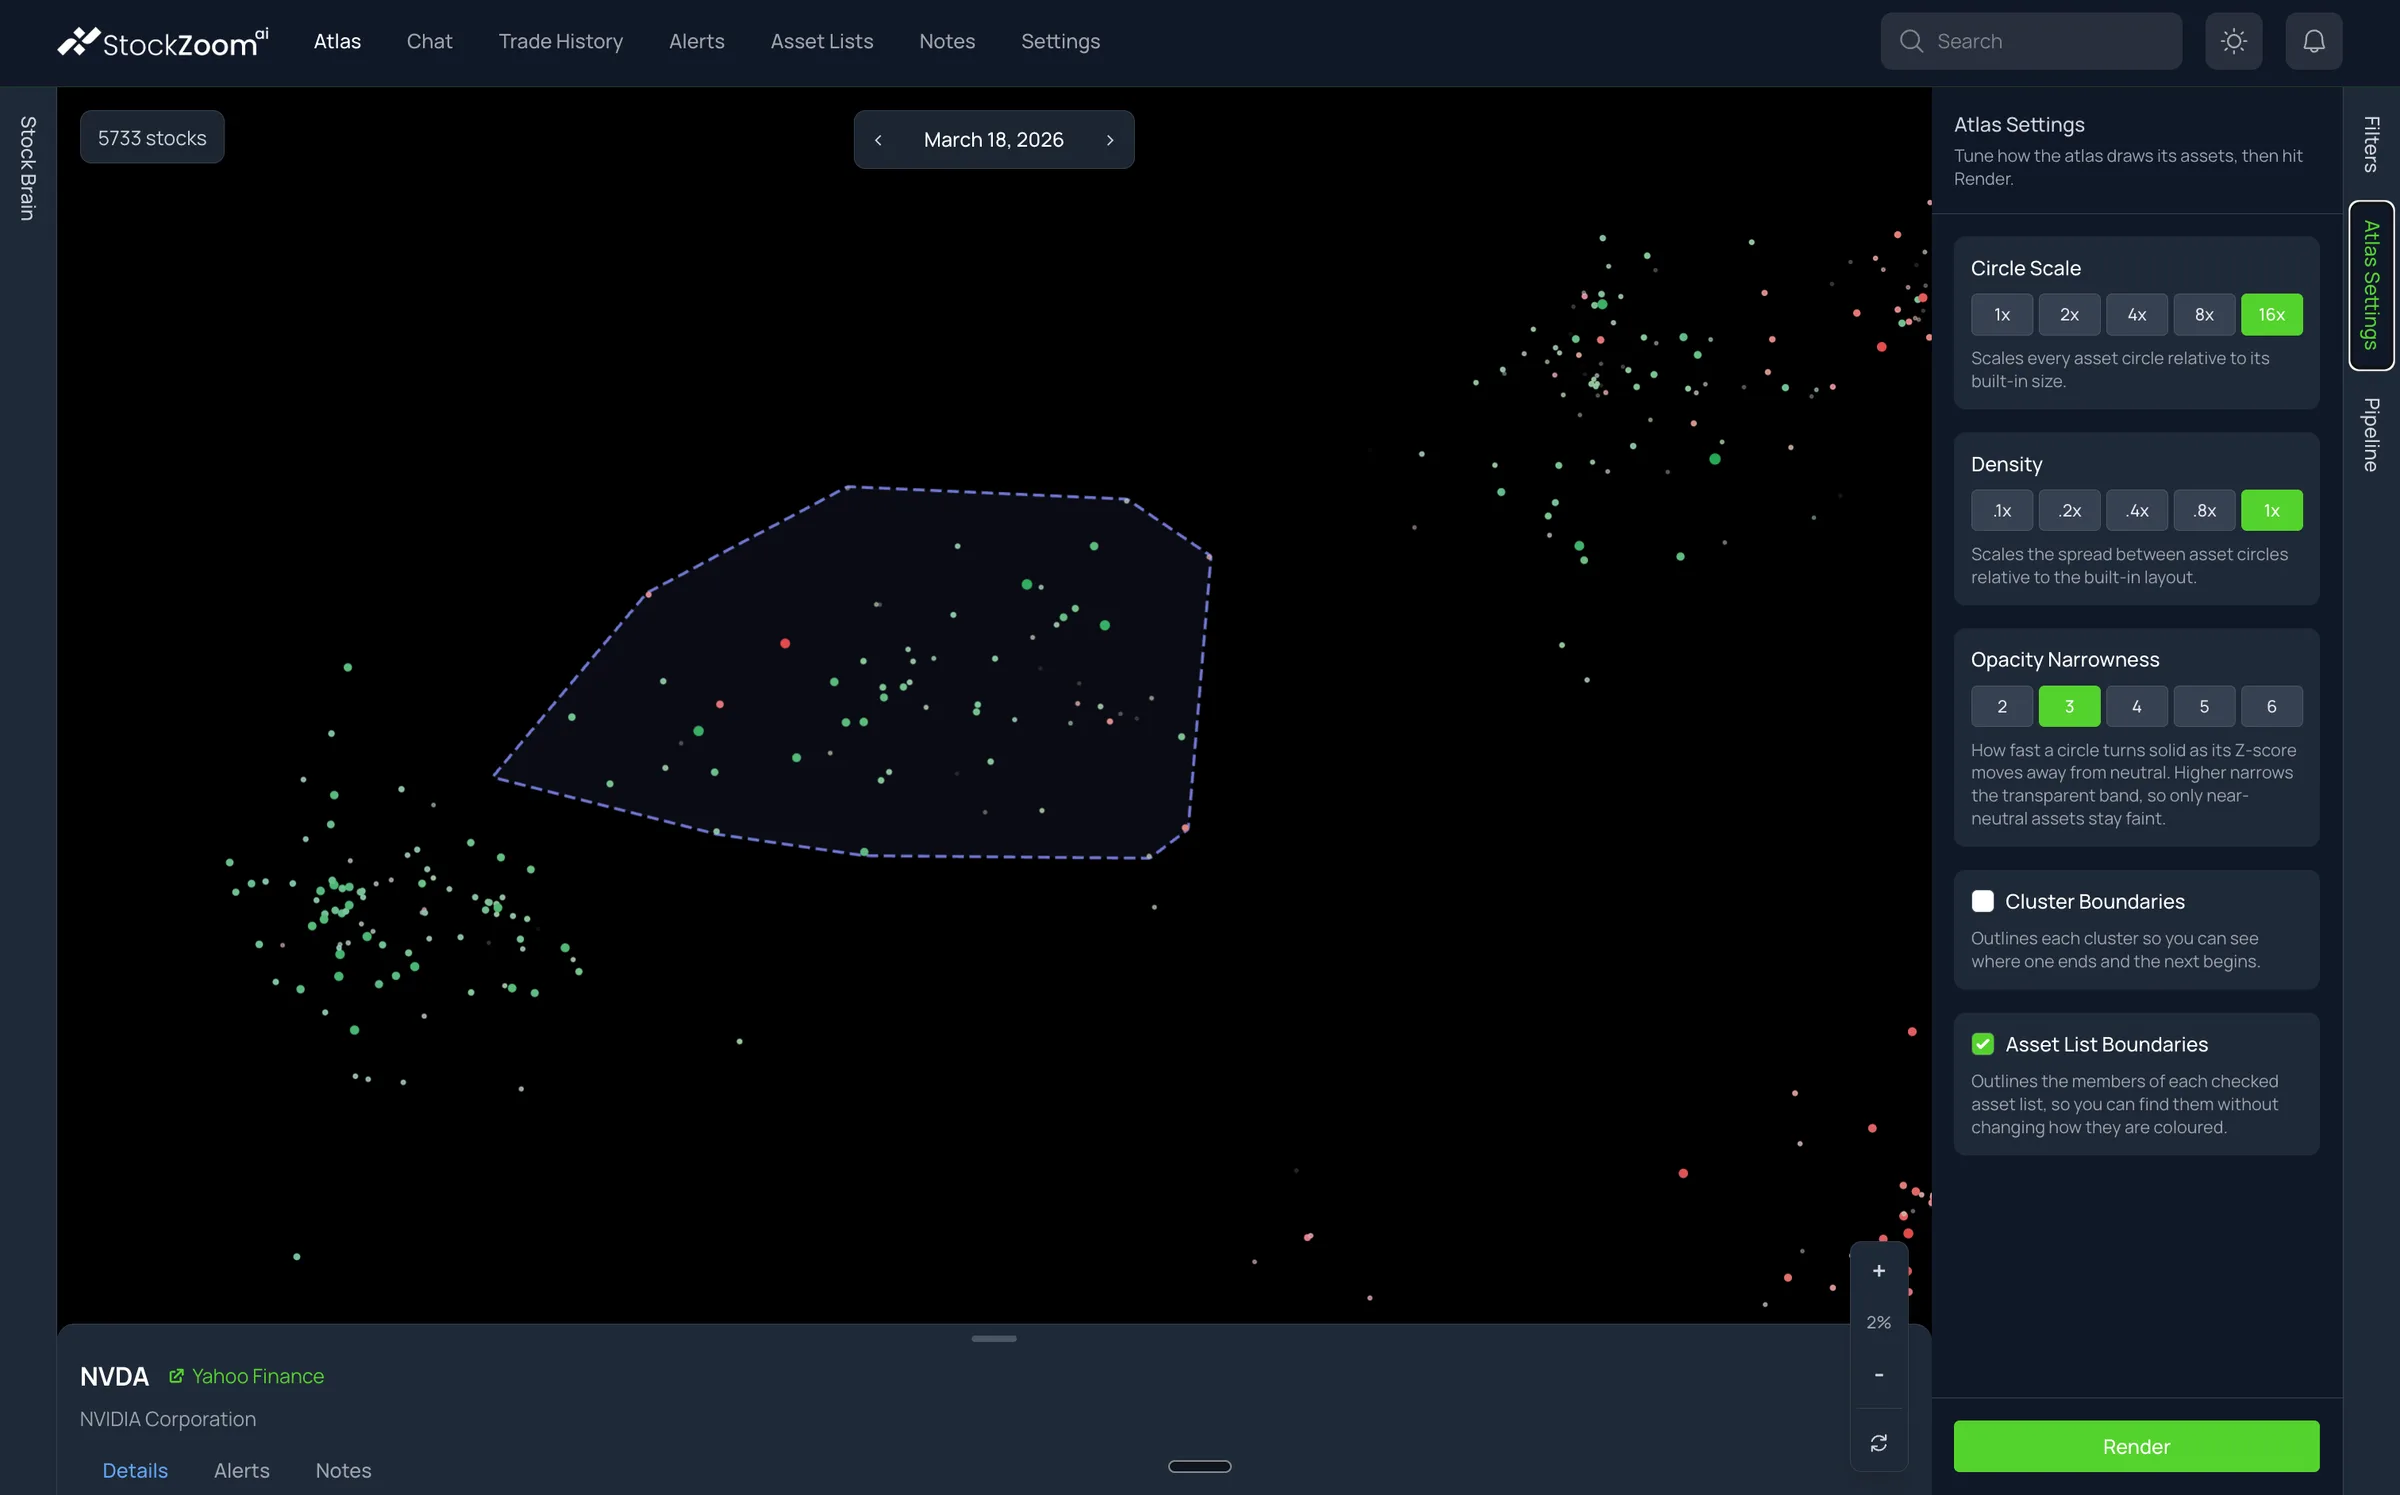
Give each visual channel a metric and a threshold, then press Render. Use Atlas Settings to scale circles up, spread the layout, or outline clusters and lists. Click any circle to open its details drawer: company name, quote and profile, the metrics behind its appearance, and a link out to Yahoo Finance.
Change one channel at a time so you can tell what each one is contributing to the picture.
Turn the region into a research list.
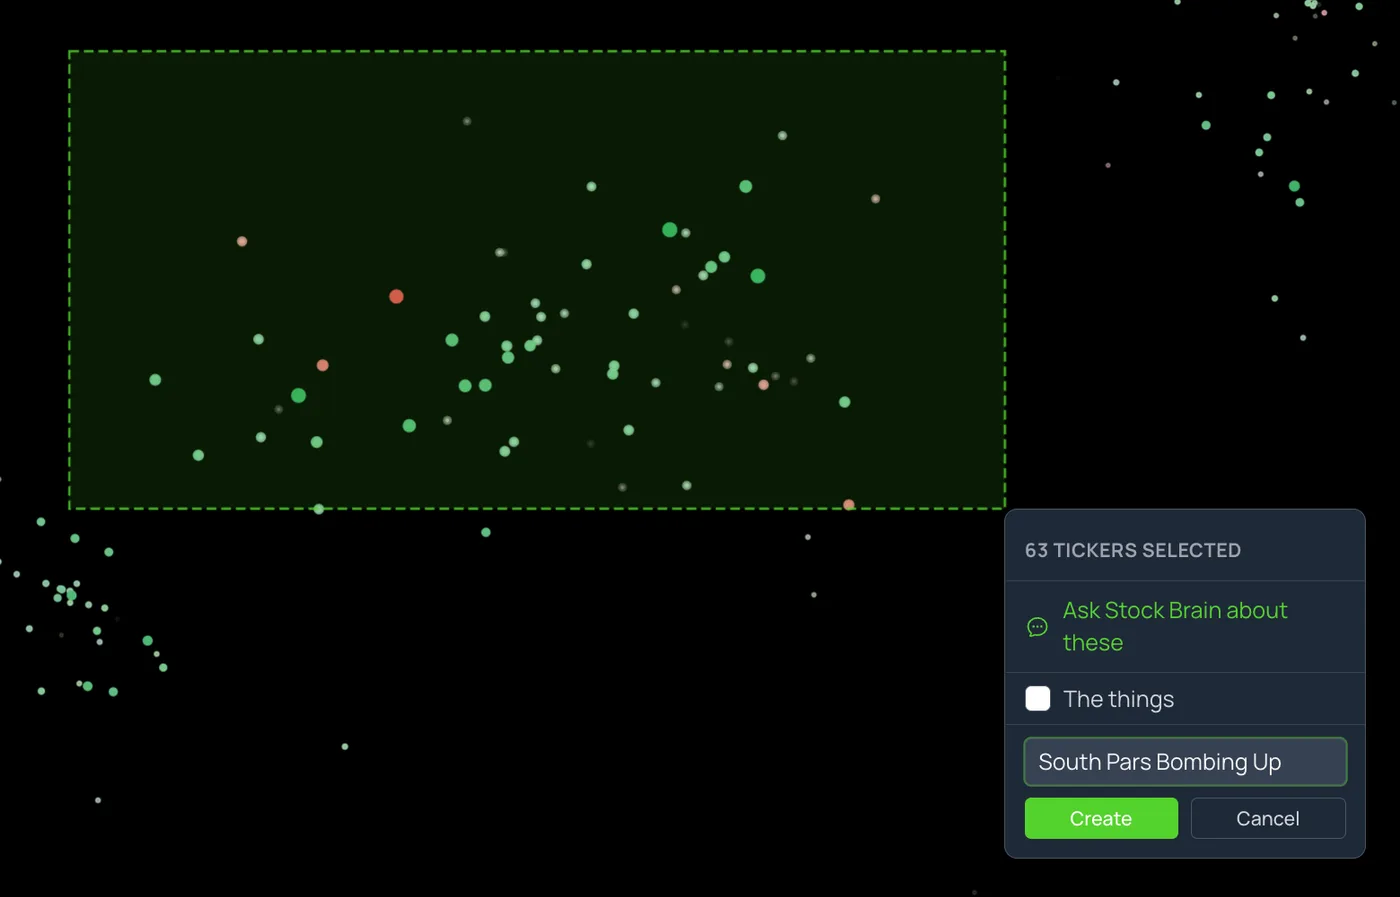
Hold Shift and drag a rectangle. StockAtlas counts the selected tickers, you give the list a name, and it appears in Asset Lists. That list is the output: a set of candidates, each with a reason to look closer.
A rectangle can capture mixed signals. Review the members in Asset Lists and remove what you did not intend.
Join the waitlist
Direct registration is coming. For now you have to join the wait list.
Note: You should join the wait list now, even if you're not entirely sold, because it's free. Also, access will be granted on a first-come, first-serve basis. You can always decline your spot. But, if you're not on the wait list or you're at the very bottom of the list, you have little-to-no chance of getting a seat. We only opened the wait list on October 3rd. So, if you join the list today, you're likely not too late.
Also, while it's true we have fewer than 9 seats left right now, we will open up more seats at some point in the future. We just haven't decided when.
The reason is that we're trying to stage the rollout so that we don't overwhelm our ability to support those who are first to get access.
Also, if we give too many access to the tool it sort of dilutes your market advantage. So we do plan to permanently restrict access to a smaller set of subscribers. And, once we hit a number we're comfortable with, we'll only make new seats available if an existing subscriber gives up their seat.
Next steps: After you join the wait list (and if we still have seats left) we will reach out to you with instructions on how you can place a deposit to reserve a guaranteed seat or alternatively, how you can purchase lifetime access if that interests you.
A clearer view. A more focused research list.
Compare dates, bring meaningful moves into focus, and save the stocks you want to investigate. Here is how StockAtlas turns a broad market view into your next research step.
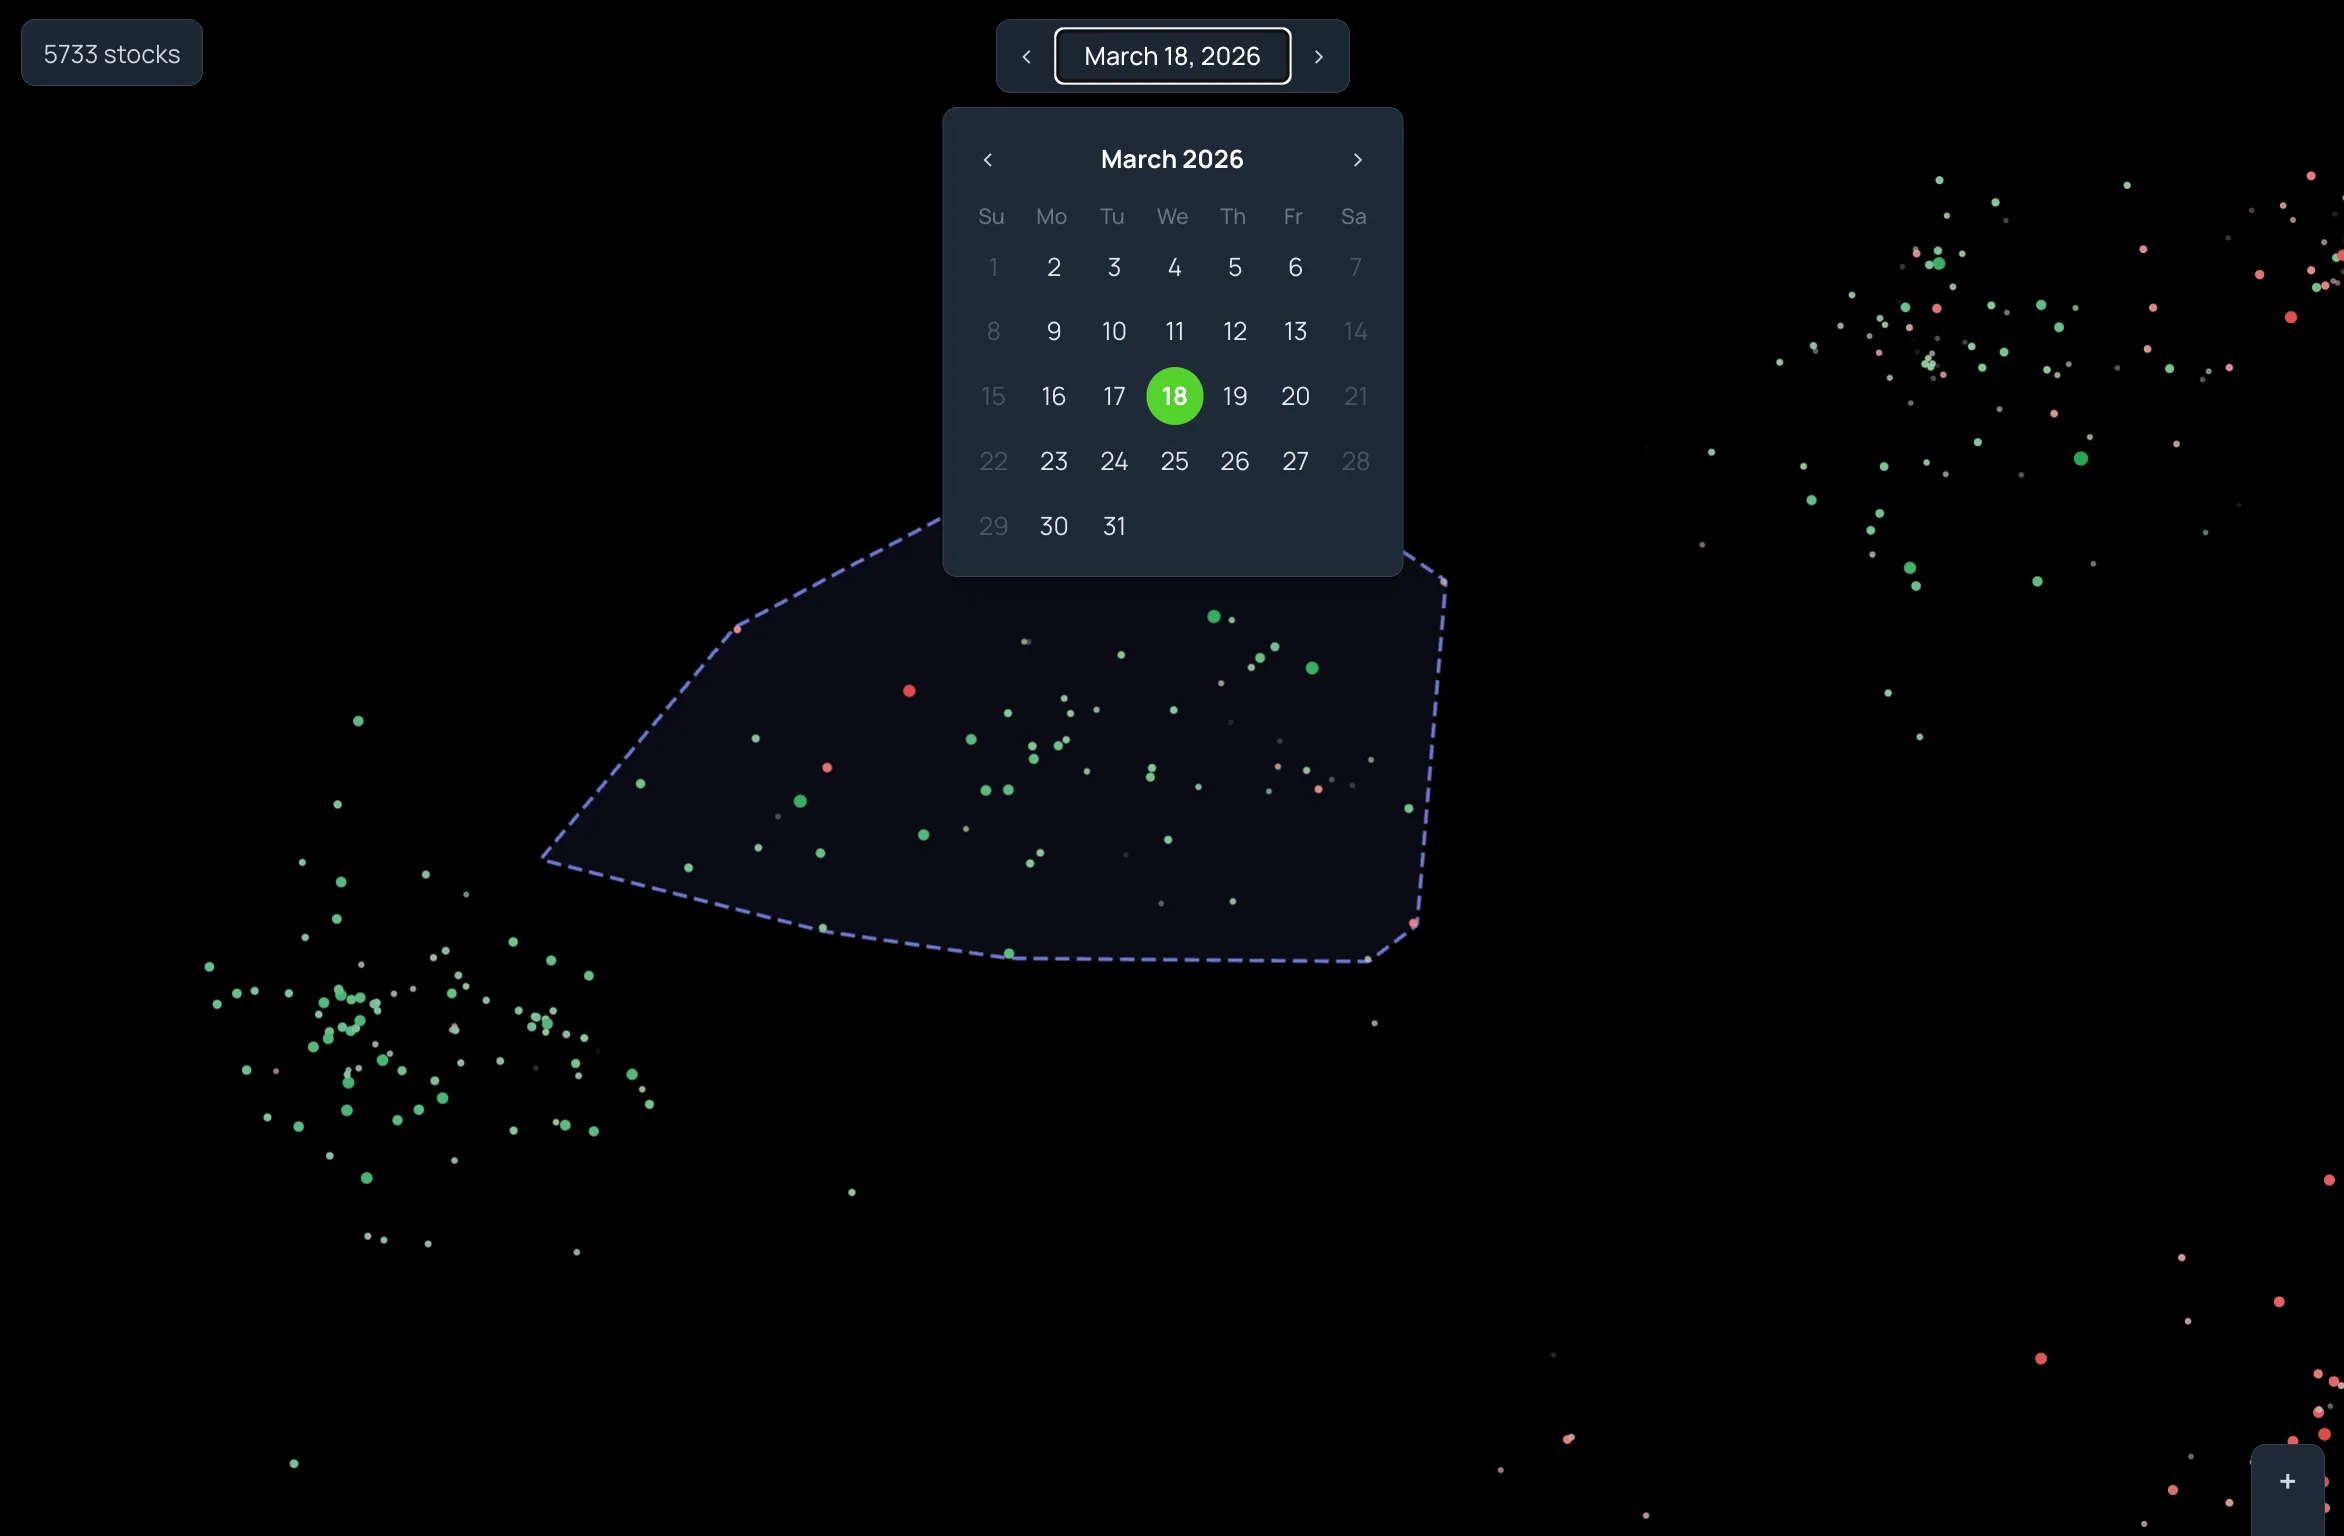
Change the date. The map stays put.
Within one relationship snapshot, instrument positions do not move when you change the date. Only the appearance changes. So you can step through the stored dates and watch a region light up or go quiet, without re-learning the map each time.
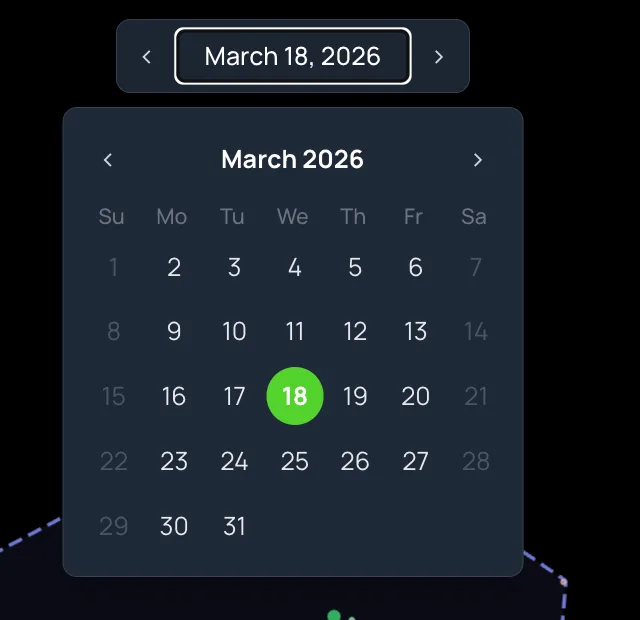
Open the calendar to jump to a specific day, or use the arrows to move between adjacent dates that have data. Keep your metrics, thresholds, and layout settings fixed while you compare, and the differences you see are differences in the market.
Browsing past dates is exploration, not a backtest. The relationship snapshot behind the layout can include observations later than the date on screen.
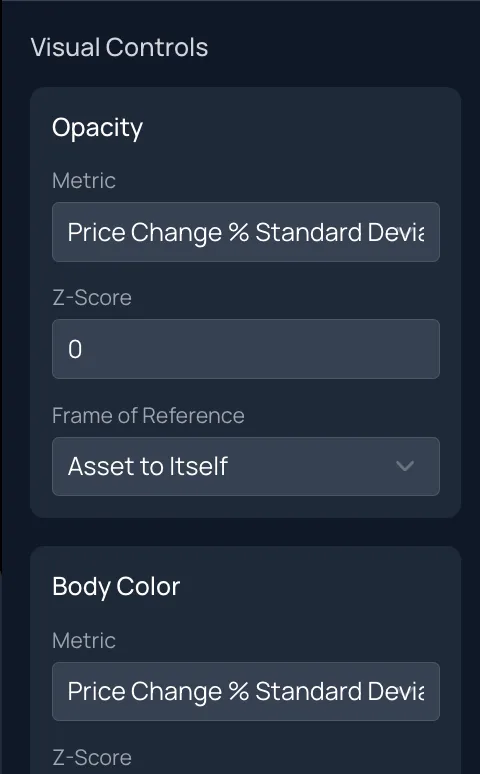
Use statistics to filter out the noise.
Each channel has its own metric dropdown and its own threshold. Assign price change measured in standard deviations to body color, a volume ratio to the border, and raise the opacity threshold so only strong moves stay solid. Press Render and the map re-draws.
- Body ColorThe sign of a metric. Green for positive scores, red for negative.
- Border ColorA second signed metric, independent of the body.
- SizeMagnitude. Larger circles are further from neutral on their metric.
- OpacityEmphasis. Circles inside your threshold fade toward transparent.
Scores are computed as Value Today divided by Value Over Window for the chosen metric. The threshold field widens or narrows the neutral band. It is an emphasis control, not a probability.
From a pattern on the map to a list of names.
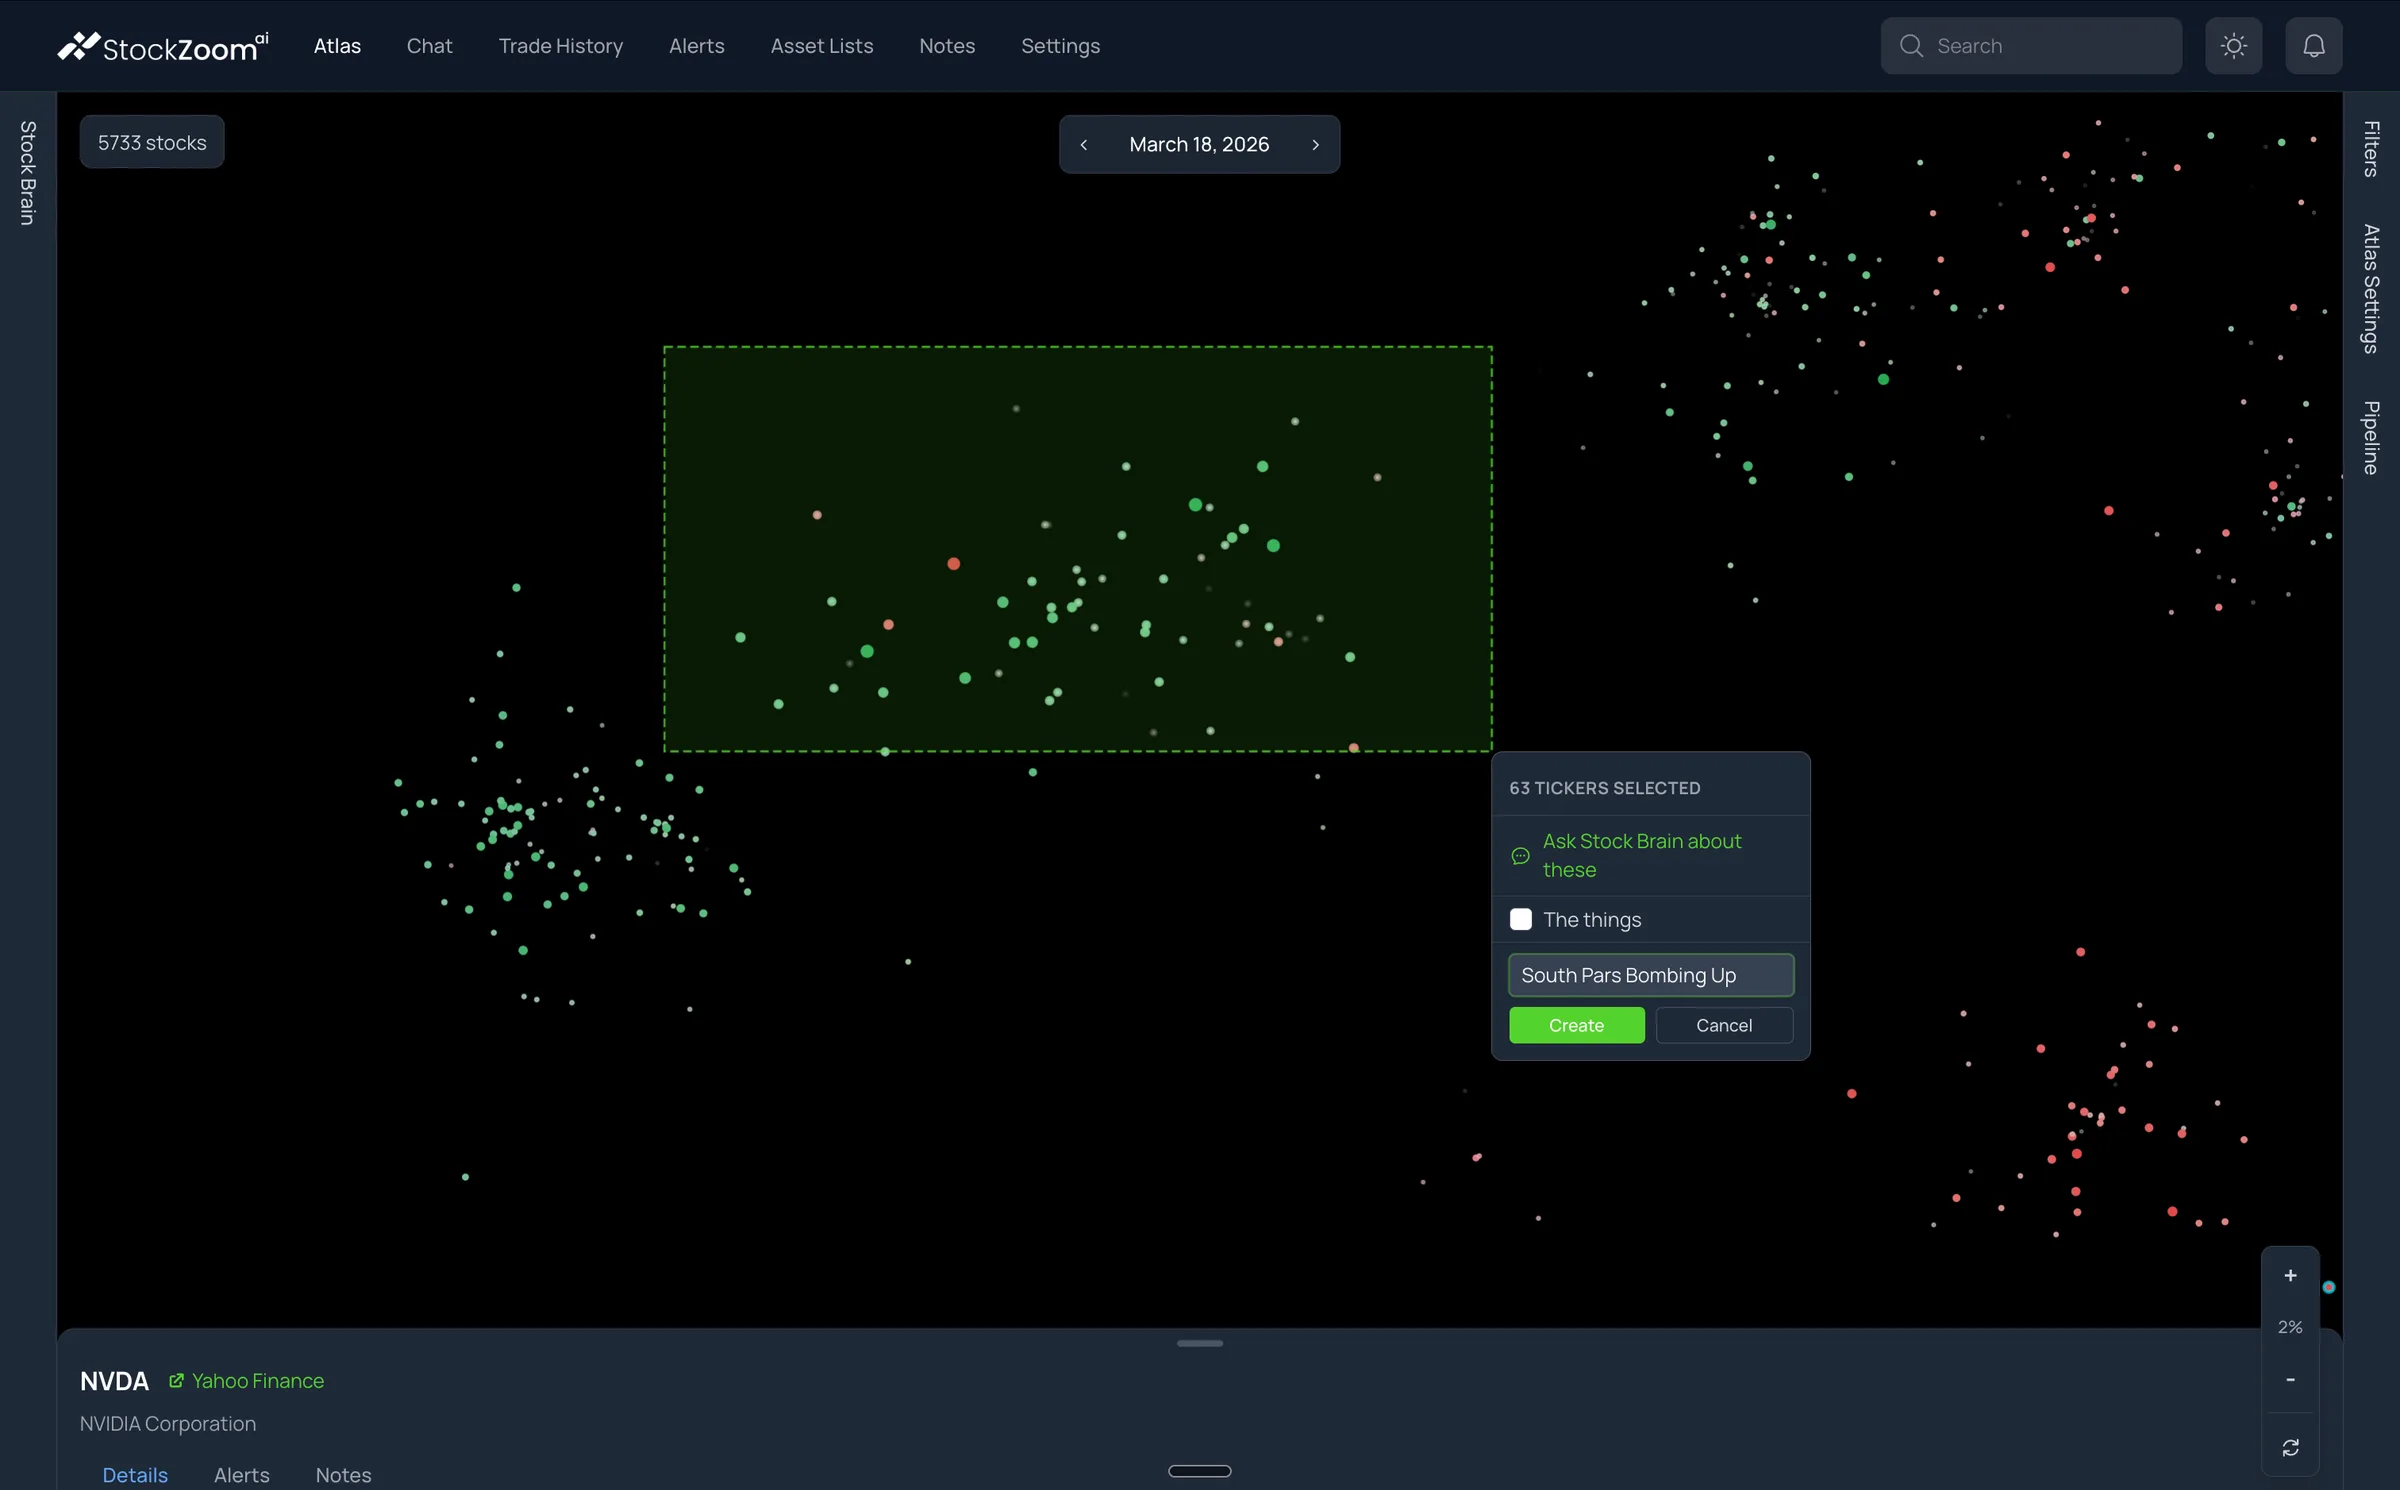
Hold Shift and drag across a region. The selection menu shows how many tickers you caught and offers to create a new list or add them to an existing one. Name it, press Create, and the symbols are waiting in Asset Lists.
Lists are ordinary working objects. Rename them, add a ticker with autocomplete, remove a member, or import a plain CSV or TXT of symbols you already have.
A selection identifies a region, not a set of winners. The 63 tickers in this capture include a few red and faint circles that a careful researcher would review before keeping.
Keep the list on the map.
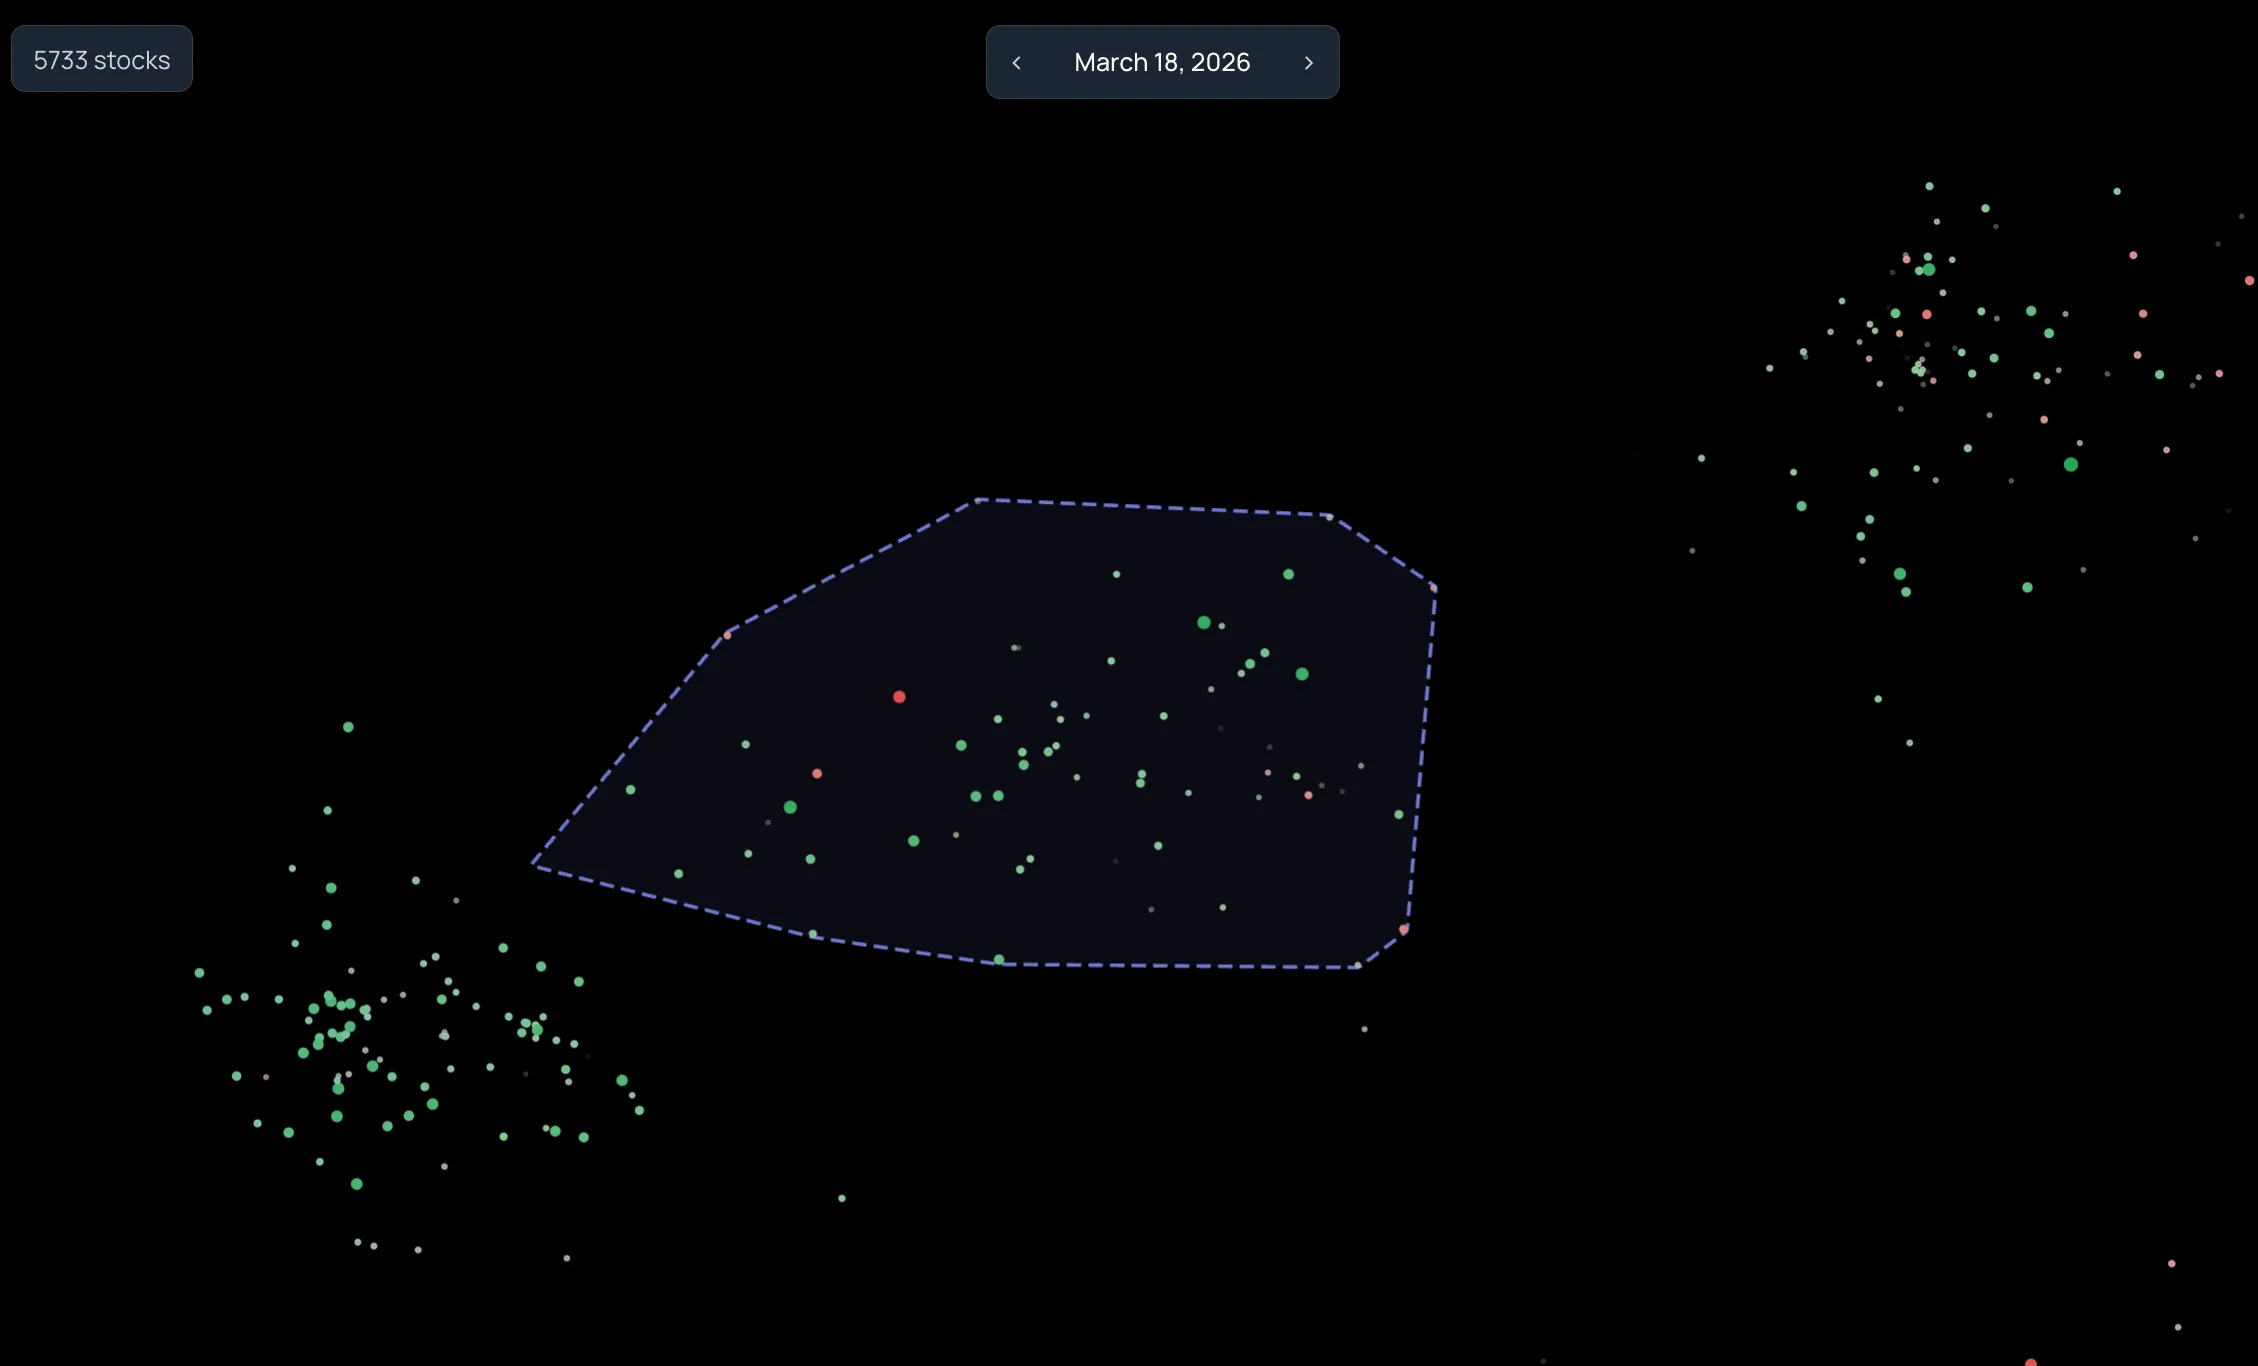
Check a list in Filters, keep Correlation Clusters on, and switch on Asset List Boundaries in Atlas Settings. StockAtlas draws an outline around the list's members without changing their colors. The neighbors just outside the outline stay visible, so you can see what you left out.
Come back on another date with the same settings, and the outline is exactly where you left it. That is what makes a saved region worth revisiting.
An event question, answered with a list.
In March 2026 a researcher wanted to know which instruments had moved together on dates tied to escalation in the Iran conflict. They did not have a list of tickers to check. They had a date.
They opened StockAtlas on March 18, 2026. Most of the market was red that day. One compact region was almost entirely green. They zoomed in, Shift-dragged across it, and saved 63 tickers as a list.
The members they reported included WTI, LNG, and XOP alongside other oil-and-gas and inverse-market instruments, several of which they had never thought to search for. The map surfaced the group. The research on each name started from there.
The list name is the researcher's hypothesis, not an established cause. StockAtlas shows what moved together. Working out why is still the researcher's job.
Start with a question, not a ticker.
Each of these sessions follows the same path: broad view, region, inspection, list. The question changes; the workflow does not.
Research a market event
"Which instruments moved together on the dates I care about?"
Open the dates tied to the event. Look for a region that shares a pattern, select it, and save the members. You leave with a candidate list instead of a guess about which sector to check.
Find the names beyond NVIDIA
"What trades like the stock I already own?"
NVIDIA caught your attention. What else belongs on your research list? Search NVDA, then explore the stocks and funds in its relationship group. Repeat with any holding to find names beyond your watchlist.
Follow a theme across labels
"Where does this thesis actually show up in the market?"
A supply-chain or energy thesis rarely respects industry codes. Groups built from return relationships can gather the instruments that respond to the same influence, whatever their label.
Explain a date to someone else
"What did this part of the market do on that day?"
Fix the settings, step through the dates, and narrate what changes in one region. The geography stays put, so an audience can follow along without losing their place.
Built for people who do their own research.
who research their own ideas and want a manageable set of names to investigate after a market move.
who need to find instruments with related behavior across classifications, not just within one.
who explain how groups of stocks behaved on specific dates and want a stable picture to point at.
StockAtlas is a desktop experience. Pan, zoom, Shift-drag selection, and right-click actions are built for a mouse or trackpad.
Founding-member pricing, before launch.
StockAtlas is in early access. Reserve a seat now, or lock in lifetime access and never see a subscription bill.
Monthly
StockAtlas month to month, with no long-term commitment.
- The full market map, thousands of instruments
- Historical date navigation
- Region selection and research lists
- New features as they ship
- Cancel anytime
Reserve a seat
Hold your place for launch and lock in founding-member pricing.
- Guaranteed access at launch
- Founding-member pricing locked in
- Priority onboarding
- A direct line to the founding team
- A vote on the feature roadmap
Lifetime access
Every StockAtlas capability, for as long as StockAtlas exists. No subscription.
- The full market map, thousands of instruments
- Historical date navigation
- Body color, border, size, and opacity controls
- Region selection and research lists
- CSV and TXT ticker import
- Instrument details drawer
- Every future feature, included
- Priority support
Join the waitlist
Direct registration is coming. For now you have to join the wait list.
Note: You should join the wait list now, even if you're not entirely sold, because it's free. Also, access will be granted on a first-come, first-serve basis. You can always decline your spot. But, if you're not on the wait list or you're at the very bottom of the list, you have little-to-no chance of getting a seat. We only opened the wait list on October 3rd. So, if you join the list today, you're likely not too late.
Also, while it's true we have fewer than 9 seats left right now, we will open up more seats at some point in the future. We just haven't decided when.
The reason is that we're trying to stage the rollout so that we don't overwhelm our ability to support those who are first to get access.
Also, if we give too many access to the tool it sort of dilutes your market advantage. So we do plan to permanently restrict access to a smaller set of subscribers. And, once we hit a number we're comfortable with, we'll only make new seats available if an existing subscriber gives up their seat.
Next steps: After you join the wait list (and if we still have seats left) we will reach out to you with instructions on how you can place a deposit to reserve a guaranteed seat or alternatively, how you can purchase lifetime access if that interests you.
Secure checkout by Stripe. No hidden fees.
Straight answers.
The things people ask before they trust a new way of looking at the market.
What clustering method does StockAtlas use?
StockAtlas currently uses K-means clustering.
We compute the pairwise Pearson correlation between all assets and treat the resulting values as an N-dimensional correlation space. Once assets are represented in that space, we can use Euclidean distance to measure how far apart they are.
We shift the correlation-derived values so that the resulting distance is always greater than or equal to zero.
How many clusters does StockAtlas use?
Right now, StockAtlas uses a fixed number of clusters that we selected based on what we believe produces a useful representation of the market.
There is nothing fundamental preventing the number of clusters from being configurable, however. That could be exposed as a user or system parameter in the future.
What features determine how assets are grouped?
The primary feature is the correlation relationship between an asset and every other asset in the market.
Instead of clustering assets based on a small set of manually selected features—such as sector, market cap, volatility, or P/E ratio—each asset is effectively represented by its correlation vector against the rest of the market.
That means the dimensionality of the clustering space grows with the number of assets being analyzed.
How is distance between assets calculated?
We calculate pairwise Pearson correlations and transform them into a distance representation.
Once assets exist in that correlation space, we use Euclidean distance to determine how similar or dissimilar their market behavior is.
Assets with similar correlation profiles tend to appear closer together, while assets with substantially different behavior appear farther apart.
How do you convert an N-dimensional market into a two-dimensional visualization?
The underlying market representation is high-dimensional, but the visualization must ultimately be rendered in two dimensions.
To orient the market, we identify four relatively uncorrelated extremes and use them to establish the major directions of the map:
x < 0x > 0y < 0y > 0
The clusters are then positioned so that the two-dimensional map preserves as much of the original correlation structure as possible.
The goal is for the relative placement of clusters to continue carrying meaningful information about how those parts of the market relate to one another.
Does the position of an individual asset inside a cluster contain information?
Yes, partially.
An asset's distance from the average position of its cluster reflects how far that asset is from the cluster's center in the original correlation space.
However, there is currently one important limitation.
If an asset is represented using polar coordinates within its cluster, its radial distance contains information, but its theta, or angular position, does not currently encode meaningful information.
That is one weakness we would like to improve in the future.
Do negative correlations create problems for clustering?
Negative correlations are part of the underlying market structure and are retained when constructing the correlation space.
Before computing distances, we transform or shift the correlation-derived values so that the resulting distance representation is always non-negative.
This allows positively correlated, weakly correlated, and negatively correlated relationships to coexist within the same geometric representation.
Do the clusters move over time?
Yes.
Because asset correlations change over time, the underlying correlation space also changes. When the system recomputes the market for another point in time, assets may move within clusters, change clusters, or cause the clusters themselves to shift relative to one another.
This makes it possible to visualize changes in the structure of the market rather than viewing clustering as a static classification.
How computationally expensive is this?
Potentially very expensive.
Pairwise correlation across large datasets requires processing millions of data points, and the clustering and visualization pipeline performs substantial numerical work on top of that.
Modern hardware makes the project practical.
Using GPUs and Apple Silicon, we can currently perform the full computation over millions of data points in approximately four to five minutes.
Once the data has been processed, the visualization can be refreshed quickly enough that moving between historical dates on a modern Apple laptop feels close to real time.
Could StockAtlas expose this data through an API or MCP server?
Yes. That is a natural extension of the system.
An API or MCP interface could expose information such as:
- cluster membership
- asset-to-asset distances
- correlation relationships
- cluster movement over time
- outliers
- changes in market structure
- historical cluster state
That data could then be combined with current market information and provided to AI agents, quantitative tools, or automated stock-analysis systems.
Instead of only rendering the market visually, StockAtlas could become a structured source of market-behavior data that other systems can reason over.
What decides where an instrument appears on the map?
Historical return relationships across the whole instrument universe. Instruments whose returns have moved together are grouped, and the layout keeps those groups near each other. The axes are not price, market cap, or valuation, and the exact pixel distance between two dots is not a correlation coefficient.
What do the colors and sizes mean?
Whatever you assign. Body color, border color, size, and opacity each take their own metric and threshold from the Visual Controls. Green and red show the sign of the body-color metric. A large or bright circle is a strong score on its metric, not a recommendation.
Does a green circle mean I should buy?
No. Green means a positive score on the metric you chose for Body Color, such as price change measured in standard deviations. StockAtlas does not generate buy or sell signals, and nothing on the map is investment advice.
Can I look at past dates?
Yes. The date control steps through the dates that have stored data, and the calendar jumps to a specific day. Within one relationship snapshot the positions stay fixed while the appearance changes with the date. This is exploratory comparison, not a backtest: the layout is not rebuilt from only the data available on that day.
Can I keep a group I find?
Yes. Hold Shift and drag across a region, then create a new list or add the selection to an existing one. Lists live in Asset Lists, where you can rename them, add or remove tickers, and import a plain CSV or TXT of symbols.
How many instruments are on the map?
Thousands. The captures on this page show 5,733 stocks and funds on their dates. Coverage depends on the dataset behind your deployment and can change as data is refreshed.
Is this a screener?
Not really. A screener needs a rule before it shows you anything. StockAtlas shows you the whole market first, then lets you emphasize what matters with thresholds. Many people use both: find a region in StockAtlas, then take the list into their screener or charting tool.
Does it work on a phone?
StockAtlas is built for a desktop browser with a mouse or trackpad. Pan, zoom, Shift-drag selection, and right-click actions do not yet have touch equivalents.
Request a demo
We know this is a new way of looking at the market. So you likely have many questions. If you feel it would be easier to talk to us and get a guided demo, we can absolutely take some time to walk you through StockAtlas via a Zoom call. That way you can watch as we move around the market, zoom in, zoom out, and you can even pick some days for us to analyze together so that you can get a feel for how the visualization allows you to explore market trends and jump back and forth in time.
Just fill out the form with your name, email address, and phone number ideally and we'll reach out to you to schedule a time.
If it's easier, you can also skip the form and just text us at:
Request received.
We will be in touch shortly to set up a time that works for you.
See the market like never before.
StockAtlas is designed to help you find trends in section of the market you were not already watching or correlated assets that you might not have caught on your own. It is patent-pending and available by waitlist only at this time.